
Determination of volume fraction of acetic acid in Chinese aged liquor by 3-D fluorescence spectrometry
-
摘要: 为了快速测定白酒年份酒中乙酸的体积分数,采用3维荧光光谱结合交替拟合残差算法,首先将不同体积分数的乙酸乙醇水溶液的3维荧光光谱作为校正集,然后将白酒的3维荧光光谱作为预测集,利用交替拟合残差算法进行解析分辨,采用标准添加法来验证结果的准确性。结果表明,预测体积分数与真实体积分数的相关系数为0.9926,平均回收率为101.97%;3维荧光光谱结合交替拟合残差算法可以快速有效地测定白酒年份酒中乙酸的体积分数。这一结果对白酒年份酒中单体体积分数的检测是有帮助的。Abstract: In order to quickly determine the volume fraction of acetic acid in Chinese aged liquor, 3-D fluorescence spectroscopy and alternate fitting residual algorithm were used. Firstly, 3-D fluorescence spectra of different volume fraction of acetic acid of ethanol aqueous solution was used as the calibration set. 3-D fluorescence spectrum of liquor was used as the predicted set. Alternate fitting residual algorithm was used to analyze. Standard addition method was used to verify the accuracy of the results. Through theoretical analysis and experimental verification, the results show that, correlation coefficient between the predicted volume fraction and the experimental volume fraction is 0.9926. Average recovery percentage is 101.97%. 3-D fluorescence spectrometry combined with alternate fitting residual algorithm can quickly and effectively determine the volume fraction of acetic acid in Chinese aged liquor. This result is helpful for the detection of monomer volume fraction in Chinese aged liquor.
-
-
![]()
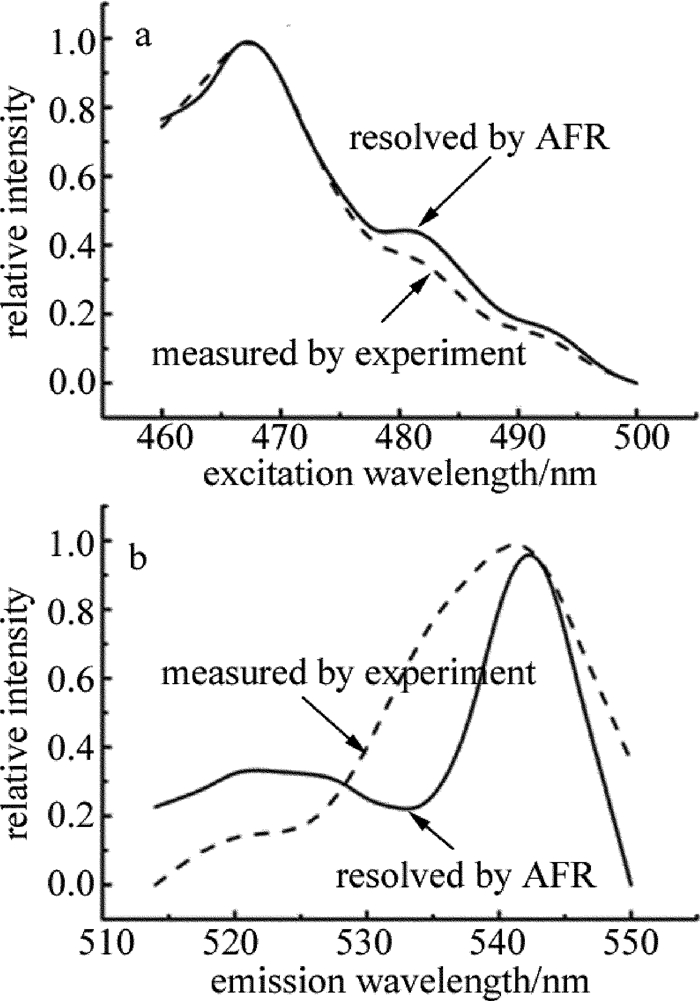
Figure 1. The spectra of acetic acid in ethanol aqueous solution obtained by AFR algorithm and experiment
![]()
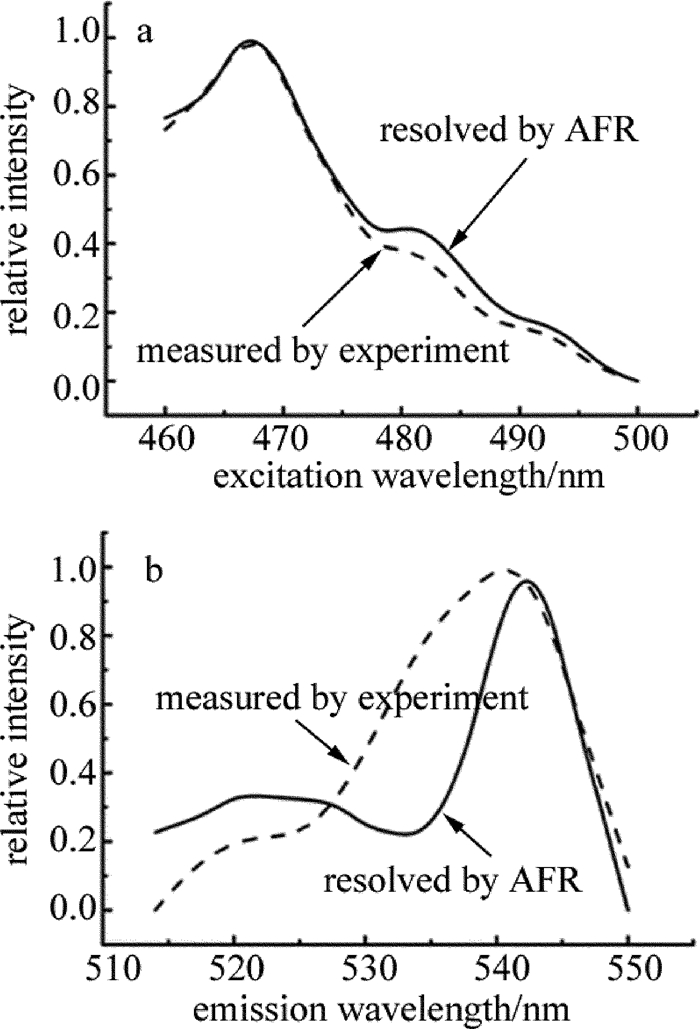
Figure 2. The spectra of acetic acid in Chinese aged liquor obtained by AFR algorithm and in ethanol aqueous solution obtained by experiment
Table 1 The concentration of calibration
calibration sample volume fraction of acetic acid 1 0.0050 2 0.0045 3 0.0040 4 0.0035 5 0.0030 6 0.0025 7 0.0020 8 0.0015 9 0.0010 10 0.0005 11 0.0000  下载: 导出CSV
Table 2 Analysis of calibration set by using AFR algorithm and leave-one-out cross-validation method
samplenumber the realvolume fraction the predicted volume fraction recoverypercentage/% 1 0.00500 0.00496 99.20 2 0.00450 0.00467 103.78 3 0.00400 0.00405 101.25 4 0.00350 0.00334 95.43 5 0.00300 0.00278 92.67 6 0.00250 0.00254 101.60 7 0.00200 0.00212 106.00 8 0.00150 0.00155 103.33 9 0.00100 0.00099 99.00 10 0.00050 0.00059 118.00 11 0.00000 -0.00009 — RMSEP 0.00162 average recovery percentage 102.03% correlation coefficient 0.9974
下载: 导出CSV
Table 3 The predicted concentration of acetic acid in Chinese aged liquor by using AFR
sample number the predicted volume fraction 1 0.00089 2 0.00119 3 0.00186 4 0.00276 5 0.00383
下载: 导出CSV
Table 4 Analysis of the predicted set by using AFR
sample number the real volume fraction the predictedvolume fraction recovery percentage/% Ⅰ 0.00165 0.00155 93.94 Ⅱ 0.00184 0.00182 98.91 Ⅲ 0.00205 0.00217 105.85 Ⅳ 0.00246 0.00252 102.44 Ⅴ 0.00264 0.00287 108.71 RMSEP 0.00045 average recovery percentage 101.97% correlation coefficient 0.9926
下载: 导出CSV
-
[1] ZHU S, LU X, JI K, et al.Characterization of flavor compounds in Chinese liquor Moutai by comprehensive two-dimensional gas chromatography/time-of-flight mass spectrometry[J]. Analytica Chimica Acta, 2007, 597(2):340-348. DOI: 10.1016/j.aca.2007.07.007
[2] ZHU W H, CHEN G Q, ZHU Zh W, et al. Year prediction of a mild aroma Chinese liquors based on fluorescence spectra and simulated annealing algorithm[J]. Measurement, 2017, 97(11):156-164. http://www.wanfangdata.com.cn/details/detail.do?_type=perio&id=cdd510bcb28f456246ac8feb43bcea96
[3] YANG J L, ZHU T, XU Y, et al. Study on ultraviolet fluorescence spectra of monomers of distilled spirits[J]. Spectroscopy and Spectral Analysis, 2009, 29(12):3339-3343(in Chinese). http://www.ncbi.nlm.nih.gov/pubmed/20210165
[4] TANG R. The relations of capproate bacteria, pit mud and Luzhou-flavour liquor[J]. Liquor Making, 2005, 32(4):24-27(in Chinese). http://en.cnki.com.cn/Article_en/CJFDTOTAL-NJZZ200504010.htm
[5] ZHU Zh W, QUE L Zh, CHEN G Q, et al.Year discrimination of mild aroma Chinese liquors using three-dimensional fluorescence spectroscopy combinedwith parallel factor and neural network[J]. Spectroscopy and Spectral Analysis, 2015, 35(9):2573-2577(in Chinese). http://europepmc.org/abstract/MED/26669170
[6] ZHU M, FAN W, XU Y, et al.1, 1-Diethoxymethane and methanethiol as age markers in Chinese roasted-sesame-like aroma and flavour type liquor[J]. European Food Research and Technology, 2016, 242(11):1985-1992. DOI: 10.1007/s00217-016-2697-x
[7] HAN S, ZHANG W, LI X, et al. Determination of three alcohols in Chinese Dukang base liquor by FT-NIR spectroscopy[J]. Food Analytical Methods, 2016, 9(8):2194-2199. DOI: 10.1007/s12161-016-0403-z
[8] MA L, SHEN X M, LI A J, et al. Determination of the content of lactic acid & acetic acid by HPLC[J]. Sichuan Food and Fermentation, 2016, 52(1):84-86(in Chinese). http://d.old.wanfangdata.com.cn/Periodical/spgykj201716047
[9] WU J F, XU Y.Comparison of pyrazine compounds in seven Chinese liquors using headspace solid-phase micro-extraction and GC-nitrogen phosphourusdetection[J]. Food Science and Biotechnology, 2013, 22(5):1-6. DOI: 10.1007/s10068-013-0209-3
[10] ZHU W, REN C, NIE Y, et al.Quantification of ochratoxin a in Chinese liquors by a new solid-phase extraction clean-up combined with HPLC-FLD method[J]. Food Control, 2016, 64(6):37-44. http://www.wanfangdata.com.cn/details/detail.do?_type=perio&id=f661f4e370bb47b26963ec988d25dc86
[11] CHEN G Q, WU Y M, WANG J, et al. Fluorescence spectroscopy study of synthetic food colors[J]. Spectroscopy and Spectral Analysis, 2009, 29(9):2518-2522(in Chinese). http://www.wanfangdata.com.cn/details/detail.do?_type=perio&id=gpxygpfx200909050
[12] ZHUNAG Y, MA Ch Q, WANG X H, et al. Simultaneous determination of three antibiotics based on synchronous fluorescence combined with neural network[J]. Laser Technology, 2017, 41(4):489-493(in Chinese). http://www.wanfangdata.com.cn/details/detail.do?_type=perio&id=jgjs201704006
[13] DU J M, CHEN G Q, MA Ch Q, et al. Determination of carmine concentration with 3-D synchronous fluorescence spectrometry[J]. Laser Technology, 2017, 41(4):489-493(in Chinese). http://www.wanfangdata.com.cn/details/detail.do?_type=perio&id=jgjs201704009
[14] URÍČKOVÁ V, SÁDECKÁ J, MÁJEK P.Classification of Slovak juniper-flavoured spirit drinks[J]. Journal of Food & Nutrition Research, 2015, 54(4):425-429. DOI: 10.1007/s12161-014-9869-8
[15] ELCOROARISTIZABAL S, CALLEJÍN R M, AMIGO J M, et al.Fluorescence excitation-emission matrix spectroscopy as a tool for determining quality of sparkling wines[J]. Food Chemistry, 2016, 206(9):284-290. http://www.wanfangdata.com.cn/details/detail.do?_type=perio&id=234ccdd7ad5ee7c42f8ce4b7a07c3bed
[16] ZHONG X D, FU D S, WU P P, et al.Rapid fluorescence spectroscopic screening method for the sensitive detection of thiabendazole in red wine[J]. Analytical Methods, 2014, 6(18):7260-7267. DOI: 10.1039/C4AY00991F
[17] WU H L, NIE J F, YU Y J, et al. Multi-way chemometric methodologies and applications:a central summary of our research work[J]. Analytica Chimica Acta, 2009, 650(1):131-142. DOI: 10.1016/j.aca.2009.05.041
[18] XIA A L, WU H L, FANG D M, et al. A novel trilinear decomposition algorithm for second-order linear calibration[J]. Chemometric and Intelligent Laboratory Systems, 2000, 52(1):75-86. DOI: 10.1016/S0169-7439(00)00081-2
计量
- 文章访问数:
- HTML全文浏览量:
- PDF下载量: