
Advances in 4-D and 5-D photoacoustic imaging techniques
-
摘要:
光声成像的出现拓展了生物医学成像技术在细胞、组织和活体中的应用,从而监测复杂内环境中的多种生理过程。通过加入时间维度或进行多光谱成像,可以获得更丰富的组织信息,实现对目标形态结构和功能成分的定性和定量分析。对4维(3维和时间或3维和光谱)、5维(3维和时间、光谱)光声成像技术及光声光谱解混技术的研究进展进行了综述,预测临床应用前景并总结出目前存在的问题,展望了未来可能的发展方向。
Abstract:The emergence of photoacoustic imaging has expanded the application of biomedical imaging technology in cells, tissues, and living organisms to monitor a variety of physiological processes in complex internal environments. Photoacoustic imaging is essentially 3-D imaging, involving three spatial dimensions. By adding time or frequency dimensions, richer tissue information can be obtained, enabling qualitative and quantitative analysis of target morphological structures and functional components. This article reviews the research progress of 4-D (3-D+time or 3-D+spectrum), 5-D (3-D+time+spectrum) photoacoustic imaging technology and photoacoustic spectral unmixing technology. and The current problems were summarized. The clinical application prospects and possible development directions in the future were predicted.z
-
0. 引言
光波在大气中传输时,因大气湍流的存在,会对光波产生光斑的扩展、光强闪烁和光束的传播方向发生偏折等一系列现象[1-3],从而限制了光电设备的性能。光波受湍流的影响主要是温度起伏引起的[4],温度起伏引起折射率的起伏,造成光束波前的畸变。通过对温度起伏的直接测量,可以计算出大气折射率结构常数Cn2[5-6]。测量温度起伏的仪器为温度脉动仪[7-8],通常利用10 μm左右的金属丝来测量单点的大气湍流强度,具有响应快速、线性度好、分辨率高等特点。将温度脉动仪放置在近地面的光电设备附近,可以测量近地面的Cn2[9-12]; 通过搭载温度脉动仪的测量塔,可以测量表面层的湍流强度随高度分布情况;将温度脉动仪搭载到探空气球上,可以测量光学站址的大气Cn2廓线[13-14]。
折射率结构常数Cn2作为一个随机量,其测量值的不确定度对于准确测量外场湍流强度、评估光电设备的性能具有重要意义。本文作者从温度脉动仪的测量原理出发,结合测量不确定度的定义,分析了影响温度脉动仪测量结果的各个因素,并定量计算了温度脉动仪的测量不确定度。
1. 温度脉动仪测量原理
1.1 测量原理
大气湍流强度的表征参数Cn2由科尔莫戈罗夫提出[15],对局部均匀和各向同性的涡流,用折射率结构函数Dn(r)来表征折射率的变化,它与测量距离r存在正比关系,与r的2/3次方成正比:
Dn(r)=⟨[n(r1+r)−n(r1)]2⟩=C2n(h)×r2/3,(l≪r≪L) (1) 式中:l为湍流内尺寸; L为湍流外尺寸; n(r1)为r1处的折射率; n(r1+r)为r1+r处的折射率; Dn(r)是根据2个观测点间折射率增量,先计算均方值再统计平均值得到; Cn2(h)为h处的比例常数,是大气湍流强度的表示方式,表示h处的平均湍流强度,量纲为m-2/3,称为折射率结构常数。
折射率的变化是由于温度起伏而产生的,在湍流的惯性区间内,2个观测点的温度结构函数DT(r)只与2个观测点间的距离r2/3有关,与2个观测点的相对方向和位置没有关系[3]。如果大气中2个观测点之间的距离在湍流惯性区的范围内,则会满足以下表达式:
DT(r)=C2T(h)×r2/3,(l≪r≪L) (2) 式中:CT2(h)是温度结构常数,单位为K2·m-2/3; r的单位是m。
空间两点的温度结构函数为:
DT(r)=⟨[T(x)−T(x+r)]2⟩ (3) 式中: T(x)和T(x+r)分别为空间中两个不同位置点的温度; 〈[T(x)-T(x+r)]2〉表示空间中两个点温度差的系综平均。
由上面的两个式子可以得出大气的温度结构函数为:
C2T(r)=⟨[T(x)−T(x+r)]2⟩×r−2/3 (4) 在光学波段,Cn2和CT2的关系[10]可以描述为:
C2n=(79.2×10⁻⁶×pT2)2×C2T (5) 式中: p是空间测量点的气压(单位为Pa); T是绝对温度(单位为K)。温度脉动仪通过测量距离r、温度T、气压p和温差的系综平均值等数值,可以算出折射率结构常数。测量温度差系综平均值[16-17]的是金属丝传感器[18],如铂丝、钨丝等。金属丝传感器的电阻值随温度变化呈线性变化。通过测量金属丝电阻值的变化,就可以推导出温度的变化。金属丝传感器的热惯性系数小,能够响应大气温度的微小和快速变化。
1.2 测量电路设计
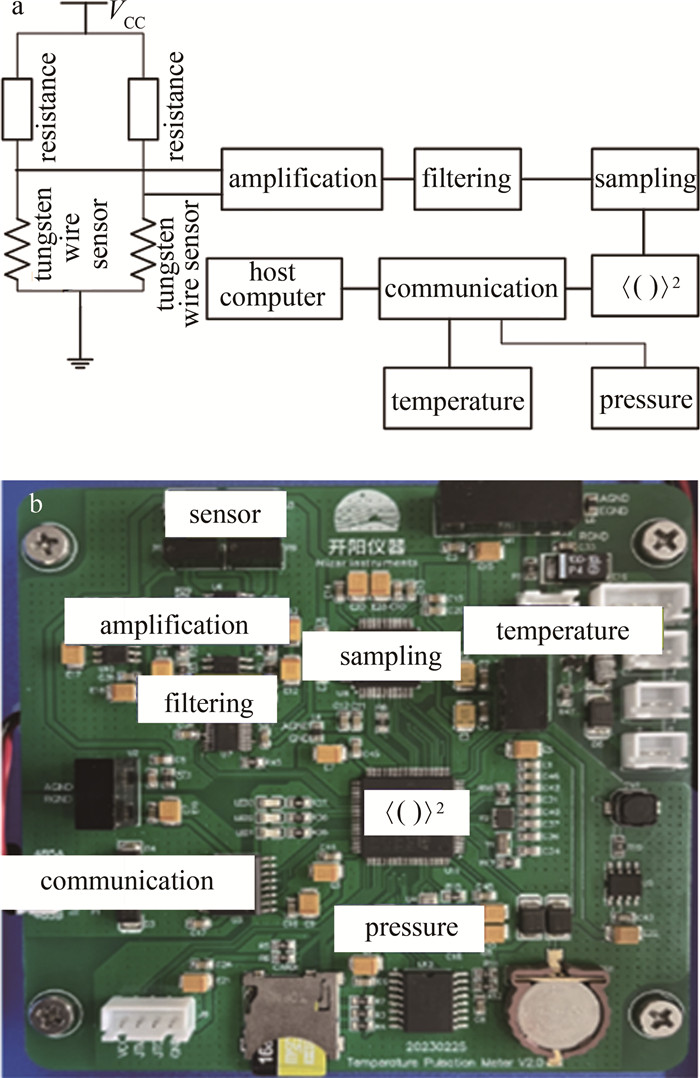
温度脉动仪的电路示意图[19]如图 1a所示。利用惠斯通电桥,经过仪表放大器、滤波、采样和计算,测量距离为r的空间两点的金属丝传感器温度差的系综平均,同时测量压强和气温,就可由前面的公式计算大气折射率结构常数。图 1b为电路实物图。
![图 1 a—温度脉动仪的电路示意图b—电路实物图]() 图 1 a—温度脉动仪的电路示意图b—电路实物图Figure 1. a—circuit diagram of temperature pulsation meter b—circuit diagram
图 1 a—温度脉动仪的电路示意图b—电路实物图Figure 1. a—circuit diagram of temperature pulsation meter b—circuit diagram2. 温度脉动仪测量不确定度分析
测量不确定度是依照所得到的数据信息,用来表征赋予被测量的量值分散性的非负参量。测量不确定度以定量的方式表示测量结果的可信度[20-22]。测量不确定度小,说明对应的特定测量获得的可能量值分布范围小,因而可信程度高,使用价值高。标准不确定度[23]通过用标准偏差的测量结果的不确定度来定义。就温度脉动仪而言,Cn2作为被测量的量,是一个随机量,因此无法通过独立重复测量的方法来估计测量不确定度,只能通过对影响Cn2的各输入量进行估计,得到合成标准不确定度。
根据式(4),影响Cn2的输入量有压强p、距离r、温度T和两点间温度差的系综平均, 则:
U(Cn2)=√U2(p)+U2(T)+U2(r)+U2(⟨[T(x)−T(x+r)]2⟩) (6) 式中: U(p)表示压强引入的不确定度,是由压强传感器的测量不确定度给出; U(T)表示温度引入的不确定度,由温度传感器的测量不确定度给出; U(CT2)表示温度结构常数的不确定度,由温度脉动的测量不确定度和距离r的测量不确定度给出。
对于压强、温度和距离r,选用合适的传感器和测量工具,各输入变量的不确定度分别为:
U(p)=±1 Pa (7) U(T)=±0.3 K (8) U(r)=±0.01 m (9) 在近地面一般测量条件下,压强p=105 Pa,距离r=1 m,温度T=20 ℃(293 K),不同的温度起伏对应的折射率结构常数见表 1。
表 1 近地面条件下不同温度起伏对应的折射率结构常数Table 1. Refractive index structure constants corresponding to different temperature fluctuations under near ground conditionsCn2/m-2/3 p/Pa T/K r/m 〈[T(x)-T(x+r)]2〉 8.5×10⁻¹⁹ 1×10⁵ 293 1 10-6 8.5×10⁻¹⁸ 1×10⁵ 293 1 10-5 8.5×10⁻¹⁷ 1×10⁵ 293 1 10-4 8.5×10⁻¹⁶ 1×10⁵ 293 1 10-3 8.5×10⁻¹⁵ 1×10⁵ 293 1 10-2 8.5×10⁻¹⁴ 1×10⁵ 293 1 10-1 8.5×10⁻¹³ 1×10⁵ 293 1 100 8.5×10⁻¹² 1×10⁵ 293 1 101 8.5×10⁻¹¹ 1×10⁵ 293 1 102 两点温度差的系综平均值由被测量大气温度起伏和噪声共同决定。其中噪声因素包括金属丝传感器及其支架的热惯性、滤波电路的影响、采样电路中的噪声、金属丝中电流的加热效应、太阳直射对金属丝传感器的加热等[24]。金属丝及其支架的惯性对高频湍流有响应衰减,金属丝中电流的加热效应和太阳直射的加热是一个稳定量,可以通过电路的高通滤波过滤去除。滤波电路的影响对电路频率的影响可通过校正系数去除。采样电路中的噪声为选用芯片的噪声决定。
采用钨丝传感器,直径为10 μm,钨丝的温度变化系数为4.5×10⁻³/K, 电阻值为90 Ω。表 2中给出了两点之间不同的温度起伏,对应的电阻值变化和压强变化。
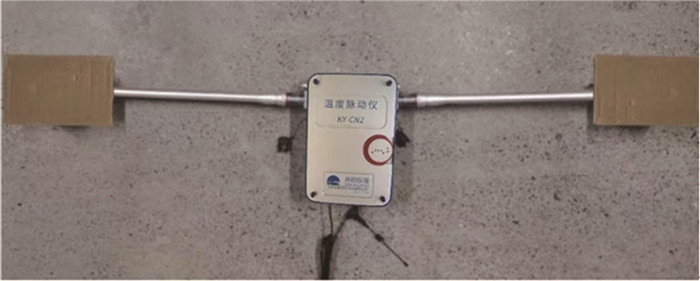
表 2 温度起伏对应的电阻值和电压变化Table 2. Changes of resistance and voltage corresponding to temperature fluctuations[T(x)-T(x+r)]/K resistance change value/Ω current value/mA voltage change value/mV 10-3 0.000405 1 0.000405 10-2 0.00405 1 0.00405 10-1 0.0405 1 0.0405 100 0.405 1 0.405 101 4.05 1 4.05 将钨丝传感器放置在密封环境中,作为没有温度变化情况,测量得到电路噪声,如图 2所示。经多次重复测量,电路电压起伏可以控制在0.00025 mV以下,对应的温度起伏为0.0003 K。图 3为一次典型的噪声测量结果,因此0.0003 K可以作为温度起伏的测量不确定度。
U(T(x)−T(x+r))=±0.0003 K (10) ![图 2 放置于封闭的纸箱内的温度脉动仪钨丝传感器]() 图 2 放置于封闭的纸箱内的温度脉动仪钨丝传感器Figure 2. Tungsten wire sensor of temperature pulsation meter in the closed cardboard box
图 2 放置于封闭的纸箱内的温度脉动仪钨丝传感器Figure 2. Tungsten wire sensor of temperature pulsation meter in the closed cardboard box利式(5)对各参量求偏微分,可以得到各参量的不确定度引起的折射率结构常数的不确定度,如表 3所示。此时, p=105 Pa,T=293 K,r=1 m,温度起伏分别为10-3 K~100 K。可以看出,折射率结构常数的测量不确定度主要由电路的噪声决定。当温度起伏在10-3 K时,电路噪声几乎和温度起伏引起的电压起伏相当,此时相对不确定度可以达到60%。随着湍流强度的增强,相对不确定度也在逐步降低。
表 3 影响温度脉动仪测量不确定度的各参量对折射率结构常数不确定度的影响Table 3. Uncertainty of refractive index structure constant caused by various parameters affecting the measurement uncertainty of temperature pulsation meter[T(x)-T(x+r)]/K U(p) U(T) U(r) U(T(x)-T(x+r)) Cn2/m-2/3 U(Cn2) relative uncertainty/% 10-3 1.7×10⁻²³ 3.5×10⁻²¹ 5.7×10⁻²¹ 5.1×10⁻¹⁹ 8.5×10⁻¹⁹ 5.1×10⁻¹⁹ 60.0 10-2 1.7×10⁻¹⁹ 3.5×10⁻¹⁹ 5.7×10⁻¹⁹ 5.1×10⁻¹⁸ 8.5×10⁻¹⁷ 5.1×10⁻¹⁸ 6.0 10-1 1.7×10⁻¹⁷ 3.5×10⁻¹⁷ 5.7×10⁻¹⁷ 5.1×10⁻¹⁷ 8.5×10⁻¹⁵ 8.4×10⁻¹⁷ 1.0 100 1.7×10⁻¹⁵ 3.5×10⁻¹⁵ 5.7×10⁻¹⁵ 5.1×10⁻¹⁶ 8.5×10⁻¹³ 6.7×10⁻¹⁵ 0.8 101 1.7×10⁻¹³ 3.5×10⁻¹³ 5.7×10⁻¹³ 5.1×10⁻¹⁵ 8.5×10⁻¹¹ 6.7×10⁻¹⁴ 0.8 3. 结论
从温度脉动仪的测量原理出发,结合测量不确定度的定义,分析了影响温度脉动仪测量结果的各个因素,并定量计算了温度脉动仪的测量不确定度。研究表明,近地面层的大气折射率结构常数的范围通常在10-13 m-2/3~10-16 m-2/3之间[25],此时温度脉动仪的测量不确定小于1%,有比较高的可信度。该研究对于提高温度脉动仪的测量分辨率有一定效果,同时也为控制其测量不确定度提供了新的解决途径。
-
![]()
![]()
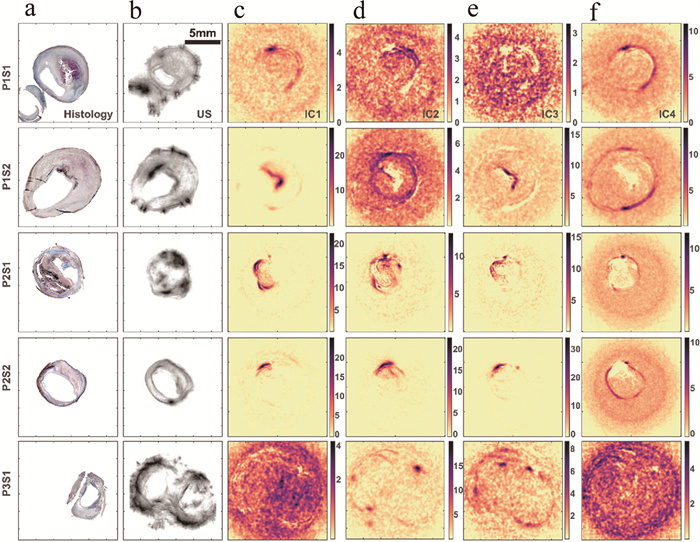
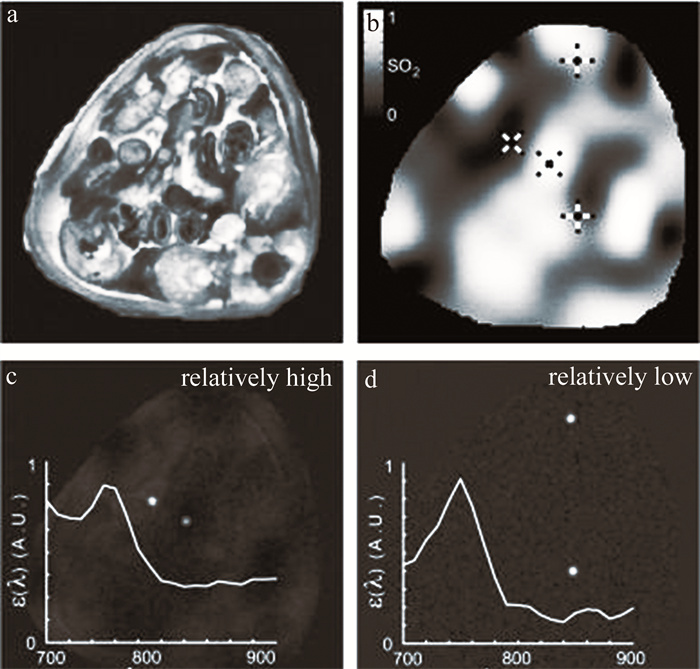
图 3 人颈动脉粥样硬化斑块样本和仿真的光声光谱测量结果[42]
a—组织学切片b—以超声图像表示的切片形态结构c~f—ICA解混算法输出的独立分量
Figure 3. Results of photoacoustic spectral measurements from human carotid atherosclerotic plaque samples and phantoms[42]
a—histological section b—ultrasound image displaying the morphological structure of the histological section c~f—independent components outputted by the ICA deconvolution algorithm
![]()
![]()
![]()
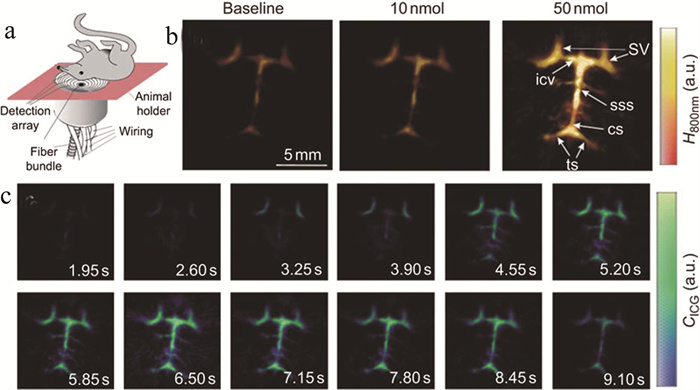
图 6 活体小鼠脑灌注5维光声成像结果[51]
a—实验装置示意图b—注射造影剂前后的单波长图像c—对注射10 nmol造影剂采集的数据进行解混后的时间序列图像
Figure 6. In vivo results of 5-D photoacoustic perfusion imaging in mouse brain[51]
a—schematic of experimental setup b—single-wavelength images before and after injection of contrast agent c—time-series of images obtained after unmixing of data collected after injection of 10 nmol of contrast agent
表 1 光声光谱解混方法对比
Table 1 Comparison of different methods for photoacoustic spectroscopy unmixing
方法 优点 缺点 线性光谱解混 算法简单,但效率低 需要提前输入预期的组织发色团 主成分分析 用于当多光谱测量的数量超过源成分的数量时的降维,并丢弃包含噪声或伪影的主成分 非约束优化过程产生不必要的数值 独立成分分析 无需先验光谱信息 源信号的非特定顺序,且受到非负限制 顶点成分分析 易于进行并行计算,加快解混过程 算法受到投影方向的约束,以及串扰噪声的影响 非负矩阵分解 有利于组织发色团的自动解混,而不需要任何关于源成分和用户交互的先验知识 未考虑光通量变化以及光衰减产生的影响 超像素光声光谱解混 可检测到不突出的光谱分布, 直接进行光通量分布的建模 对于光通量的模拟局限于已知的情况,预测精度不高  下载: 导出CSV
-
[1] WU D, TAO Ch, LIU X J, et al. Photoacoustic tomography reconstruction in a 2-D chaotic cavity using time reversal[J]. International Journal of Thermophysics, 2013, 34(8/9): 1646-1651.
[2] ERMILOV S A, KHAMAPIRAD T, ANDRE C, et al. Laser optoacoustic imaging system for detection of breast cancer[J]. Journal of Biomedical Optics, 2009, 14(2): 024007. DOI: 10.1117/1.3086616
[3] YIN B Zh, XING D, WANG Y, et al. Fast photoacoustic imaging system based on 320-element linear transducer array[J]. Physics in Medicine and Biology, 2004, 49(7): 1339-1346. DOI: 10.1088/0031-9155/49/7/019
[4] JEROME G, ARAQUE C M A, ALEXANDER D, et al. Three-dimensional optoacoustic tomography using a conventional ultrasound linear detector array: Whole-body tomographic system for small animals[J]. Medical Physics, 2013, 40(1): 013302. DOI: 10.1118/1.4770292
[5] HANS-PETER B, RICHARD S, MATTHEW F, et al. Whole-body three-dimensional optoacoustic tomography system for small animals[J]. Journal of Biomedical Optics, 2009, 14(6): 064007.
[6] LAN H R, JIANG D H, GAO F, et al. Deep learning enabled real-time photoacoustic tomography system via single data acquisition channel[J]. Photoacoustics, 2021, 22: 100270. DOI: 10.1016/j.pacs.2021.100270
[7] XIANG L Zh, WANG B, JI L J, et al. 4-D photoacoustic tomography[J]. Scientific Reports, 2013, 3(1): 1113. DOI: 10.1038/srep01113
[8] JIANG D, XU Y, LAN H, et al. Size-adjustable ring-shape photoacoustic tomography imager in vivo[J]. Journal of Biophotonics, 2022, 15(7): e202200070. DOI: 10.1002/jbio.202200070
[9] YANG J, CHOI S, KIM C. Practical review on photoacoustic computed tomography using curved ultrasound array transducer[J]. Biomedical Engineering Letters, 2021, 12(1): 1-17.
[10] SUN Y, WANG Y B, LI W Zh, et al. Real-time dual-modal photoacoustic and fluorescence small animal imaging[J]. Photoacoustics, 2024, 36: 100593. DOI: 10.1016/j.pacs.2024.100593
[11] CHO S, KIM M, AHN J, et al. An ultrasensitive and broadband transparent ultrasound transducer for ultrasound and photoacoustic imaging in-vivo[J]. Nature Communications, 2024, 15(1): 1444. DOI: 10.1038/s41467-024-45273-4
[12] DEÁN-BEN X L, JAMES F S, DANIEL R. High-frame rate four dimensional optoacoustic tomography enables visualization of cardiovascular dynamics and mouse heart perfusion[J]. Scientific Reports, 2015, 5(1): 10133. DOI: 10.1038/srep10133
[13] DEÁN-BEN X L, RAZANSKY D. Portable spherical array probe for volumetric real-time optoacoustic imaging at centimeter-scale depths[J]. Optics Express, 2013, 21(23): 28062-28071. DOI: 10.1364/OE.21.028062
[14] AMY L H, DEÁN-BEN X L, IVANA I, et al. Characterization of cardiac dynamics in an acute myocardial infarction model by four-dimensional optoacoustic and magnetic resonance imaging[J]. Theranostics, 2017, 7(18): 4470-4479. DOI: 10.7150/thno.20616
[15] MITRADEEP S, MAILYN P, GILLES R, et al. Motion rejection and spectral unmixing for accurate estimation of in vivo oxygen saturation using multispectral optoacoustic tomography[J]. IEEE Transactions on Ultrasonics, Ferroelectrics, and Frequency Control, 2023, 70(12): 1671-1681. DOI: 10.1109/TUFFC.2023.3306592
[16] 余双春, 袁杰. 复频域实时重建医学光声图像的研究[J]. 南京大学学报(自然科学), 2016, 52(3): 536-541. YU Sh Ch, YUAN J. Realtime reconstruction of the medical complex frequency domain photoacoustic image[J]. Journal of Nanjing University Natural Science, 2016, 52(3): 536-541(in Chinese).
[17] JEON S, PARK E Y, CHOI W, et al. Real-time delay-multiply-and-sum beamforming with coherence factor for in vivo clinical photoacoustic imaging of humans[J]. Photoacoustics, 2019, 15: 100136. DOI: 10.1016/j.pacs.2019.100136
[18] DEÁN-BEN X L, BAY E, RAZANSKY D. Functional optoacoustic imaging of moving objects using microsecond-delay acquisition of multispectral three-dimensional tomographic data[J]. Scientific Reports, 2014, 4(1): 5878. DOI: 10.1038/srep05878
[19] NEUSCHMELTING V, BURTON N C, LOCKAU H, et al. Performance of a multispectral optoacoustic tomography (MSOT) system equipped with 2D vs. 3D handheld probes for potential clinical translation[J]. Photoacoustics, 2016, 4(1): 1-10. DOI: 10.1016/j.pacs.2015.12.001
[20] JIAN X H, DONG F L, XU J, et al. Frequency domain analysis of multiwavelength photoacoustic signals for differentiating tissue components[J]. International Journal of Thermophysics, 2018, 39(5): 1-9.
[21] CHUAH S Y, ATTIA A B E, HO C J H, et al. Volumetric multispectral optoacoustic tomography for 3-dimensional reconstruction of skin tumors: A further evaluation with histopathologic correlation[J]. The Journal of Investigative Dermatology, 2019, 139(2): 481-485. DOI: 10.1016/j.jid.2018.08.014
[22] REGENSBURGER A P, WAGNER A L, DANKO V, et al. Multispectral optoacoustic tomography for non-invasive disease phenotyping in pediatric spinal muscular atrophy patients[J]. Photoacoustics, 2022, 25: 100315. DOI: 10.1016/j.pacs.2021.100315
[23] LISANNE G, EPAMEINONDAS G, CARLOTTA B, et al. Preoperative mapping of lymphatic vessels by multispectral optoacoustic tomography[J]. Lymphatic Research and Biology, 2022, 20(6): 659-664. DOI: 10.1089/lrb.2021.0067
[24] HUANG N, HE M, SHI H Sh, et al. Curved-array-based multispectral photoacoustic imaging of human finger joints[J]. IEEE Transactions on Biomedical Engineering, 2018, 65(7): 1452-1459. DOI: 10.1109/TBME.2017.2758905
[25] KUMAR M D, CHRISTOS M, MICHAEL M, et al. High-pulse energy supercontinuum laser for high-resolution spectroscopic photoacoustic imaging of lipids in the 1650-1850 nm region[J]. Biomedical Optics Express, 2018, 9(4): 1762-1770. DOI: 10.1364/BOE.9.001762
[26] TAKASHI B, CONLEY N C, CHOI S W. Multispectral photoacoustic microscopy of lipids using a pulsed supercontinuum laser[J]. Biomedical Optics Express, 2018, 9(1): 276-288. DOI: 10.1364/BOE.9.000276
[27] SEONYEONG P, BROOKS F J, UMBERTO V, et al. Normalization of optical fluence distribution for three-dimensional functional optoacoustic tomography of the breast[J]. Journal of Biomedical Optics, 2022, 27(3): 036001.
[28] CHRISTOPH D, IVAN O, BASAK K C, et al. Deep-learning-based electrical noise removal enables high spectral optoacoustic contrast in deep tissue[J]. IEEE Transactions on Medical Imaging, 2022, 41(11): 3182-3193. DOI: 10.1109/TMI.2022.3180115
[29] O'KELLY D, GUO Y H, MASON R P. Evaluating online filtering algorithms to enhance dynamic multispectral optoacoustic tomography[J]. Photoacoustics, 2020, 19: 100184. DOI: 10.1016/j.pacs.2020.100184
[30] JIAN H X, DONG L F, XU J, et al. Frequency domain analysis of multiwavelength photoacoustic signals for differentiating tissue components[J]. International Journal of Thermophysics, 2018, 39(5): 1-9.
[31] FADHEL N M, HYSI E, ASSI H, et al. Fluence-matching technique using photoacoustic radiofrequency spectra for improving estimates of oxygen saturation[J]. Photoacoustics, 2020, 19: 100182. DOI: 10.1016/j.pacs.2020.100182
[32] ANIWAT J, BO L, LIU Y F, et al. Recurrent and convolution neural networks for sequential multispectral optoacoustic tomography (MSOT) imaging[J]. Journal of Biophotonics, 2023, 16(11): e202300142. DOI: 10.1002/jbio.202300142
[33] JNAWALI K, CHINNI B, DOGRA V, et al. Deep 3D convolutional neural network for automatic cancer tissue detection using multispectral photoacoustic imaging[J]. Proceedings of the SPIE, 2019, 10955: 109551D.
[34] EGHBAL A, ATAHAR M, SREYANKAR N, et al. Classification of human ovarian cancer using functional, spectral, and imaging features obtained from in vivo photoacoustic imaging[J]. Biomedical Optics Express, 2019, 10(5): 2303-2317. DOI: 10.1364/BOE.10.002303
[35] THOMAS K, MARTIN F. Multiple illumination learned spectral decoloring for quantitative optoacoustic oximetry imaging[J]. Journal of Biomedical Optics, 2021, 26(8): 085001.
[36] MA X, CAO M, SHEN Q H, et al. Adipocyte size evaluation based on photoacoustic spectral analysis combined with deep learning method[J]. Applied Sciences, 2018, 8(11): 2178. DOI: 10.3390/app8112178
[37] YOON H, LUKE P G, EMELIANNOV Y S. Impact of depth-dependent optical attenuation on wavelength selection for spectroscopic photoacoustic imaging[J]. Photoacoustics, 2018, 12: 46-54. DOI: 10.1016/j.pacs.2018.10.001
[38] EUNWOO P, LEE Y J, LEE C, et al. Effective photoacoustic absorption spectrum for collagen-based tissue imaging[J]. Journal of Biomedical Optics, 2020, 25(5): 1-8.
[39] HIRASAWA T, IWATATE R J, KAMIYA M, et al. Multispectral photoacoustic imaging of tumours in mice injected with an enzyme-activatable photoacoustic probe[J]. Journal of Optics, 2017, 19(1): 014002. DOI: 10.1088/2040-8978/19/1/014002
[40] JVRGEN G, DELIOLANIS N C, ANDREAS B, et al. Blind source unmixing in multi-spectral optoacoustic tomography[J]. Optics Express, 2011, 19(4): 3175-3184. DOI: 10.1364/OE.19.003175
[41] GRASSO V, HASSAN H W, MIRTAHERI P, et al. Recent advances in photoacoustic blind source spectral unmixing approaches and the enhanced detection of endogenous tissue chromophores[J]. Frontiers in Signal Processing, 2022, 2: 984901. DOI: 10.3389/frsip.2022.984901
[42] ARABUL M U, RUTTEN M C M, BRUNEVAL P, et al. Unmixing multi-spectral photoacoustic sources in human carotid plaques using non-negative independent component analysis[J]. Photoacoustics, 2019, 15: 100140. DOI: 10.1016/j.pacs.2019.100140
[43] DING L, DEÁN-BEN X L, LUTZWEILER C, et al. Efficient non-negative constrained model-based inversion in optoacoustic tomography[J]. Physics in Medicine and Biology, 2015, 60(17): 6733-6750. DOI: 10.1088/0031-9155/60/17/6733
[44] DING L, DEÁN-BEN X L, BURTON N C, et al. Constrained inversion and spectral unmixing in multispectral optoacoustic tomography[J]. IEEE Transactions on Medical Imaging, 2017, 36(8): 1676-1685. DOI: 10.1109/TMI.2017.2686006
[45] DEÁN-BEN X L, DELIOLANIS C N, NTZIACHRISTOS V, et al. Fast unmixing of multispectral optoacoustic data with vertex component analysis[J]. Optics and Lasers in Engineering, 2014, 58: 119-125.
[46] GRASSO V, HOLTHOF J, JOSE J. An automatic unmixing approach to detect tissue chromophores from multispectral photoacoustic imaging[J]. Sensors, 2020, 20(11): 3235. DOI: 10.3390/s20113235
[47] GRASSO V, REGINE W, JITHIN J. Superpixel spectral unmixing framework for the volumetric assessment of tissue chromophores: A photoacoustic data-driven approach[J]. Photoacoustics, 2022, 26: 100367. DOI: 10.1016/j.pacs.2022.100367
[48] DURAIRAJ D A, AGRAWAL S, JOHNSTONBAUGH K, et al. Unsupervised deep learning approach for photoacoustic spectral unmixing[J]. Proceedings of the SPIE, 2020, 11240: 112403H.
[49] CAMILO C, CATARINA M, AMIR G, et al. Blind spectral unmixing for characterization of plaque composition based on multispectral photoacoustic imaging[J]. Scientific Reports, 2023, 13(1): 4119. DOI: 10.1038/s41598-023-31343-y
[50] CAMILO C, NASTARAN R M, AMIR G, et al. Deep learning assisted classification of spectral photoacoustic imaging of carotid plaques[J]. Photoacoustics, 2023, 33: 100544. DOI: 10.1016/j.pacs.2023.100544
[51] DEÁN-BEN X L, RAZANSKY D. Adding fifth dimension to optoacoustic imaging: Volumetric time-resolved spectrally enriched tomography[J]. Light: Science & Applications, 2014, 3(1): e137.
[52] MORSCHER S, DRIESSEN H P W, CLAUSSEN J, et al. Semi-quantitative multispectral optoacoustic tomography (MSOT) for volumetric PK imaging of gastric emptying[J]. Photoacoustics, 2014, 2(3): 103-110. DOI: 10.1016/j.pacs.2014.06.001
[53] HERZOG E, TARUTTIS A, BEZIERE N, et al. Optical imaging of cancer heterogeneity with multispectral optoacoustic tomography[J]. Radiology, 2012, 263(2): 461-468. DOI: 10.1148/radiol.11111646
[54] GOTTSCHALK S, FEHM T F, DEÁN-BEN X L, et al. Noninvasive real-time visualization of multiple cerebral hemodynamic parameters in whole mouse brains using five-dimensional optoacoustic tomography[J]. Journal of Cerebral Blood Flow & Metabolism, 2015, 35(4): 531-535.
[55] REBER J, WILLERSHÄUSER M, KARLAS A, et al. Non-invasive measurement of brown fat metabolism based on optoacoustic imaging of hemoglobin gradients[J]. Cell Metabolism, 2018, 27(3): 689-701. DOI: 10.1016/j.cmet.2018.02.002
[56] AGRAWAL S, FADDEN C, DANGI A, et al. Light-emitting-diode-based multispectral photoacoustic computed tomography system[J]. Sensors, 2019, 19(22): 4861. DOI: 10.3390/s19224861
[57] NEDA D, BERKAN L, ÖZBEK A, et al. Deep learning of image-and time-domain data enhances the visibility of structures in optoacoustic tomography[J]. Optics Letters, 2021, 46(13): 3029-3032. DOI: 10.1364/OL.424571

计量
- 文章访问数: 8
- HTML全文浏览量: 1
- PDF下载量: 4