
Noise evaluation method for land-based hyperspectral images based on edge elimination
-
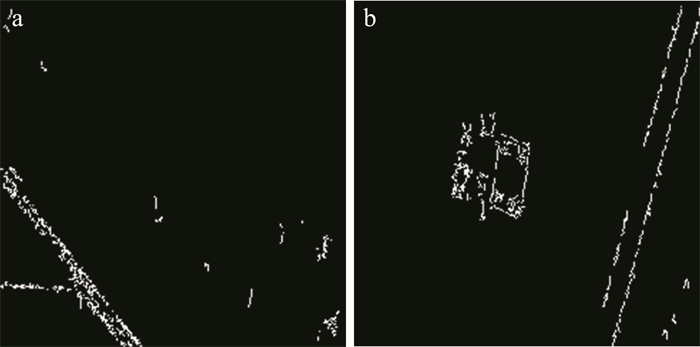
摘要: 为了准确地对陆基成像条件下高光谱图像的噪声水平进行评估, 提出了一种基于边缘剔除后残差调整的局部标准差法。首先将获取的高光谱图像分成若干个大小合适的子块, 而后利用Canny边缘检测算子检测出图像的边缘信息, 判断并剔除其中含有边缘的子块, 将剔除边缘子块后的均匀子块采用多元线性回归后求取残差的方法进行噪声估计。结果表明, 对同一幅陆基高光谱图像的不同子区域进行4×4像元与8×8像元分块, 得到的噪声总误差值分别为1.985×10³与2.197×10³。该噪声估计方法对陆基成像条件下高光谱图像的噪声评估具有较强的鲁棒性, 可为后续陆基高光谱图像处理与应用提供参考。Abstract: In order to estimate the noise levels of hyperspectral images under ground-based imaging conditions accurately, a residual-scaled local standard deviations (RLSD) method after edge elimination was proposed. Firstly, the obtained hyperspectral image was divided into several sub-blocks of appropriate size, and then the edge information of the image was detected by using Canny edge detection operator, and the sub-blocks containing edges were judged and eliminated. The noise estimation of the uniform sub-blocks after the removal of edge sub-blocks was carried out by the method of multiple linear regression and residual error. The total error of noise was 1.985×10³ and 2.197×10³ for different sub-regions of the same land-based hyperspectral images by 4×4 pixel and 8×8 pixel segmentation. The results show that the proposed noise estimation method is robust to the noise evaluation of hyperspectral images under the condition of land-based imaging, which provides a reference for the subsequent processing and application of land-based hyperspectral images.
-
Keywords:
- spectroscopy /
- hyperspectral image /
- noise assessment /
- edge elimination
-
引言
在物体结构测量时,有非光学探测和光学测量方式,其中光学测量技术因为具有非接触、测量速度高、系统结构简单等优点被广泛地应用[1-4]。随着纳米技术的快速发展,对成像系统的空间分辨率的要求越来越高。由于携带物体高频细节信息的倏逝波沿着物体表面按指数衰减,在波长量级的距离内很快衰减为0,导致成像系统在远场受到衍射效应的限制。由于倏逝波携带了物体的更多高频细节信息,利用在近场扫描探测的方法可以获得倏逝波实现超越衍射极限的分辨率,如近场扫描光学显微镜和受激发射损耗荧光显微镜[5-6]。1972年,ASH等人通过近场扫描显微镜,获得了超分辨率显微成像,由于其是通过探针在近场区域逐点进行扫描测量物体的信息,耗时长,无法实时地成像[5]。2000年,PENDRY通过介电常数和磁导率均为负数的材料制成了完美透镜将倏逝波放大,实现了在近场突破衍射极限的成像[7]。2004年, 美国加州大学ZHANG团队利用银板制成了近场透镜[8], 为了实现远场超分辨率成像,2007年,该团队首先利用负折射率材料制成的超级透镜将倏逝波放大,然后利用光栅的频移特性将倏逝波转换成传输波,实现远场超分辨率成像[9], 同年,他们使用双曲透镜实现了远场超分辨率成像,其结构必须严格设计,在实际应用时也受到了限制[10]。近年来,利用微球结合普通的光学显微镜在远场实现了突破衍射极限的分辨率,有结构简单、成本低等优点[11-21],吸引了许多国内外众多学者的关注。作者通过折射率为2、半径为26.5μm的钛酸钡微球与光学显微镜相结合, 实现对蓝光光盘的远场超分辨成像。
1. 理论分析
1.1 普通光学显微镜的极限分辨率
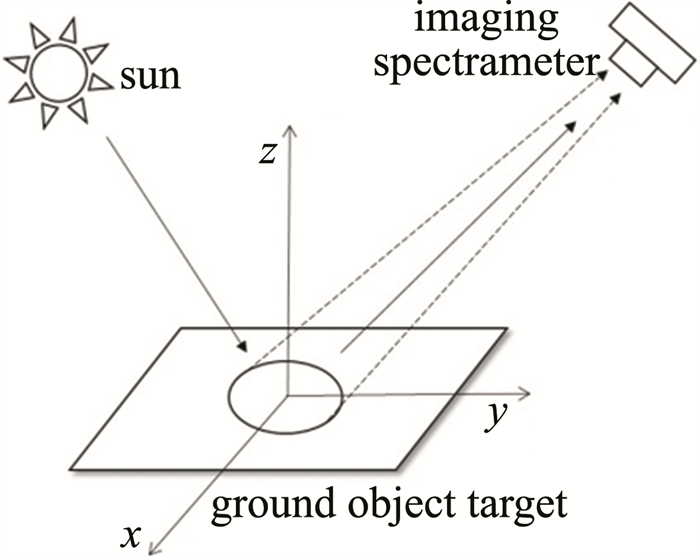
普通光学显微成像系统记录过程的简化模型如图 1所示。(x, y)为物体所在的平面,垂直于物平面的z轴为光的传播方向,物平面距显微物镜面的距离为d1, 显微物镜面的距离与像面的距离为d2, d1和d2满足物像关系。
当用一束平面光波垂直照射被测物体后,在物体表面,即z=0处,物体光波场的分布为[18-22]:
\begin{array}{c} u(\mathit{x}, \mathit{y}, 0) = \\ \int_{ - \infty }^{ + \infty } {\int_{ - \infty }^{ + \infty } U } \left( {{\mathit{\boldsymbol{k}}_x}, {\mathit{\boldsymbol{k}}_y};0} \right)\exp \left[ {{\rm{i}}\left( {{\mathit{\boldsymbol{k}}_x}x + {\mathit{\boldsymbol{k}}_y}y} \right)} \right]{\rm{d}}{\mathit{\boldsymbol{k}}_x}{\rm{d}}{\mathit{\boldsymbol{k}}_\mathit{y}} \end{array} (1) 式中, (kx, ky)为沿着x, y方向的空间波矢分量。
在空气中传播距离d1后的物体光波场为:
\begin{array}{c} u(\mathit{x}, \mathit{y}, {\mathit{d}_1}) = \int_{ - \infty }^{ + \infty } {\int_{ - \infty }^{ + \infty } U } \left( {{\mathit{\boldsymbol{k}}_x}, {\mathit{\boldsymbol{k}}_y}, 0} \right) \times \\ \exp \left[ {{\rm{i}}\left( {{\mathit{\boldsymbol{k}}_x}x + {\mathit{\boldsymbol{k}}_y}y + {\mathit{\boldsymbol{k}}_\mathit{z}}{\mathit{d}_1}} \right)} \right]{\rm{d}}{\mathit{\boldsymbol{k}}_x}{\rm{d}}{\mathit{\boldsymbol{k}}_\mathit{y}} \end{array} (2) 式中, kz2=k02-kx2-ky2,k0为不同方向叠加的空间波矢,k0=2π/λ为光波在传播方向的波数,kz为沿着z方向的空间波矢分量, λ为照明光波波长。
(2) 式表示物体光波场是由空间频率为(kx, ky)的无穷多组平面波沿不同传播方向的叠加,每组平面波可表示为[21-22]:
\mathit{U}\left( {{\mathit{\boldsymbol{k}}_x}, {\mathit{\boldsymbol{k}}_y}, 0} \right){\rm{exp}}\left[ {{\rm{i}}\left( {{\mathit{\boldsymbol{k}}_x}x + {\mathit{\boldsymbol{k}}_y}y + {\mathit{\boldsymbol{k}}_\mathit{z}}\mathit{z}} \right)} \right] (3) 当k02>kx2+ky2时,传播距离d1后其光场分布为:
\begin{array}{c} \mathit{U}\left( {{\mathit{\boldsymbol{k}}_x}, {\mathit{\boldsymbol{k}}_y}, 0} \right){\rm{exp}}\left[ {{\rm{i}}\left( {{\mathit{\boldsymbol{k}}_x}x + {\mathit{\boldsymbol{k}}_y}y} \right)} \right] \times \\ {\rm{exp}}({\rm{i}}\sqrt {\mathit{\boldsymbol{k}}_0^2 - \mathit{\boldsymbol{k}}_\mathit{x}^2 - \mathit{\boldsymbol{k}}_\mathit{y}^2} {\mathit{d}_1}) \end{array} (4) 引入一个相位延迟因子 {\rm{exp}}({\rm{i}}\sqrt {\mathit{\boldsymbol{k}}_0^2 - \mathit{\boldsymbol{k}}_\mathit{x}^2 - \mathit{\boldsymbol{k}}_\mathit{y}^2} {\mathit{d}_1}) ,表示传播距离d1后只引起了各个频谱分量的相对相位,属于低空间频率分量的传输波。
当k02 < kx2+ky2=k//2时, \sqrt {\mathit{\boldsymbol{k}}_0^2 - \mathit{\boldsymbol{k}}_\mathit{x}^2 - \mathit{\boldsymbol{k}}_\mathit{y}^2} = {\rm{i}}\mathit{\mu } 为纯虚数,其中 \mathit{\mu = }\sqrt {\mathit{\boldsymbol{k}}_x^2 - \mathit{\boldsymbol{k}}_y^2 - \mathit{\boldsymbol{k}}_0^2} ,传播距离d1后其光场分布为:
\mathit{U}\left( {{\mathit{\boldsymbol{k}}_x}, {\mathit{\boldsymbol{k}}_y}, 0} \right){\rm{exp}}( - \mathit{\mu }{\mathit{d}_1}){\rm{exp}}\left[ {{\rm{i}}\left( {{\mathit{\boldsymbol{k}}_x}x + {\mathit{\boldsymbol{k}}_y}y} \right)} \right] (5) 此称为倏逝波,随着传播距离d1的增加,其振幅按指数规律衰减,当传播距离大于一个波长λ时很快衰减为0。由于d1≫λ,倏逝波没有达到显微物镜面,不能参与远场成像。成像系统频谱分布如图 2所示。
能参与远场成像的传输波被限制为k02>kx2+ky2,其最大的横向空间波矢为:
{\mathit{\boldsymbol{k}}_{//, {\rm{max}}}} = {\mathit{\boldsymbol{k}}_0} (6) 因此, 远场成像的横向最高空间频率被限制在[7, 20-21]:
{f_{//, {\rm{max}}}} = \frac{{{\mathit{\boldsymbol{k}}_{//, {\rm{max}}}}}}{{2{\rm{ \mathsf{ π} }}}} = \frac{1}{\mathit{\lambda }} (7) 如图 2所示,横向频率小于1/λ时,为传输波; 横向频率大于1/λ时,为倏逝波,沿着传播方向衰减,在探测器处无法探测到。因此远场成像系统的空间分辨率为[7, 20]:
\mathit{\delta = }\frac{1}{{2{\mathit{f}_{//, {\rm{max}}}}}} = \frac{\mathit{\lambda }}{2} (8) 因此普通光学显微镜的极限分辨率为λ/2。由于倏逝波携带了纳米结构样品的更多亚波长细节信息,为了在远场实现超越衍射极限的分辨率,需要收集到倏逝波。
1.2 基于微球的超分辨率成像
当横向波矢量满足k02 < kx2+ky2=k//2时,由(5)式可知,在传播距离为λ处倏逝波会衰减为0,在远场不能参与成像。当将微球放置于物体的表面, 如图 3所示。为了简单起见,分析y=0的情况。半径为R、折射率为n的微球放置于物体的表面,其与物体的接触点为O。取微球边缘的P点作为入射点,由于倏逝波在空气中传播波长λ的距离处时会衰减为0,因此需满足h < λ,其中h为P点到物体表面的垂直距离。u和w分别表示过P点的切向和法向方向,w与z之间的夹角为θ。在空气中,k0分解到x和y方向的波矢量分别为kx和ky。
![Figure 3. The simplified model of the microsphere-based optical microscopic imaging system]() Figure 3. The simplified model of the microsphere-based optical microscopic imaging system
Figure 3. The simplified model of the microsphere-based optical microscopic imaging system微球中,分解到u和w方向的波矢量分别为ku和kw,且满足:
\mathit{\boldsymbol{k}}_u^2 + \mathit{\boldsymbol{k}}_w^2 = {\mathit{n}^2}\mathit{\boldsymbol{k}}_0^2 (9) 当倏逝波入射到微球时,通过Snell定量可知,微球内沿着u方向的波矢量ku可以表示为[18-19]:
\begin{array}{c} \mathit{\boldsymbol{k}}_u^2 = \mathit{\boldsymbol{k}}_x^2{\rm{co}}{{\rm{s}}^2}\mathit{\theta + }\mathit{\boldsymbol{k}}_\mathit{z}^2{\rm{si}}{{\rm{n}}^2}\mathit{\theta } = \\ \mathit{\boldsymbol{k}}_x^2{\rm{co}}{{\rm{s}}^2}\mathit{\theta } - {\left| {{\mathit{\boldsymbol{k}}_z}} \right|^2}{\rm{si}}{{\rm{n}}^2}\mathit{\theta } \end{array} (10) 当kx2cos2θ-|kz|2sin2θ>n2k02时,传播到微球中仍然为倏逝波,在远场衰减为0。
当kx2cos2θ-|kz|2sin2θ < n2k02时,在微球中将倏逝波转换成了传输波。因此,倏逝波通过微球后,微球将部分倏逝波转换成传输波,通过显微物镜成像在探测器上。f为显微物镜的焦距,d1和d2同样满足物像关系。由此可得kx满足如下的关系[18-20]:
\mathit{\boldsymbol{k}}_0^2 \le \mathit{\boldsymbol{k}}_x^2 \le \frac{{\mathit{\boldsymbol{k}}_0^2({\mathit{n}^2} - {\rm{si}}{{\rm{n}}^2}\mathit{\theta })}}{{1 - 2{\rm{si}}{{\rm{n}}^2}\mathit{\theta }}} (11) 式中, {\rm{sin}}\mathit{\theta } \approx \sqrt {2\mathit{Rh}} /\mathit{R} ,代入(11)式可得:
\mathit{\boldsymbol{k}}_x^2 \le \frac{{\mathit{\boldsymbol{k}}_0^2({\mathit{n}^2}\mathit{R} - 2\mathit{h})}}{{\mathit{R} - 4\mathit{h}}} (12) 物体散射后产生的倏逝波在微球里传播与微球的半径和折射率有关,且需满足(12)式。
由(12)式可知,通过微球后可获得最大的空间频率为:
{\mathit{f}_{{\rm{max}}}} = \frac{{{\mathit{\boldsymbol{k}}_{//, {\rm{max}}}}}}{{2{\rm{ \mathsf{ π} }}}} = \frac{1}{\mathit{\lambda }}\sqrt {\frac{{{\mathit{n}^2}\mathit{R} - 2\mathit{h}}}{{\mathit{R} - 4\mathit{h}}}} (13) 微球光学显微成像系统可分辨的最小距离为:
\mathit{d} = \frac{1}{{2{\mathit{f}_{{\rm{max}}}}}} = \frac{\mathit{\lambda }}{2}\sqrt {\frac{{\mathit{R} - 4\mathit{\lambda }}}{{{\mathit{n}^2}\mathit{R} - 2\mathit{\lambda }}}} (14) 由(14)式可知,微球光学显微成像系统可分辨的最小距离与微球的折射率和半径有关。由于n2R-2λ-(R-4λ)>0,由(14)式可得:
d < \frac{\mathit{\lambda }}{2} (15) 2. 仿真研究
利用COMSOL Multiphysics软件来分析微球的光纳米喷射特性。用波长为400nm的平行光照射折射率为1.46、半径分别为5μm和26.5μm的二氧化硅微球以及折射率为2、半径为26.5μm的钛酸钡微球后,产生的光纳米喷射结果分别如图 4a、图 4b和图 4c所示。分别在其光纳米喷射光斑的最大光强处作出沿着竖直方向上的强度分布如图 5所示。仿真结果表明,微球对平行光产生光纳米喷射的作用,且其光纳米喷射光斑的半径小于λ/2;从仿真结果图 4a、图 4b和图 5可以看出,对相同折射率不同半径的微球,光喷射的尺寸随着微球半径的增大而增大;从图 4b、图 4c和图 5可以看出,对相同半径不同折射率的微球,光喷射的尺寸随着折射率的增大而减小,说明微球具有收集倏逝波的作用。当成像系统中加入微球后可以使其分辨率突破衍射极限。
![Figure 4. Simulation results of the photonic nanojet by the microspheres]() Figure 4. Simulation results of the photonic nanojet by the microspheresa—n=1.46, r=5μm b—n=1.46, r=26.5μm c—n=2, r=26.5μm
Figure 4. Simulation results of the photonic nanojet by the microspheresa—n=1.46, r=5μm b—n=1.46, r=26.5μm c—n=2, r=26.5μm![Figure 5. The intensity distribution of the photonic nanojet in the maximum intensity along the vertical direction]() Figure 5. The intensity distribution of the photonic nanojet in the maximum intensity along the vertical direction
Figure 5. The intensity distribution of the photonic nanojet in the maximum intensity along the vertical direction3. 基于微球超分辨率成像的实验研究
将钛酸钡微球与光学显微镜组合成远场超分辨率成像系统,其实验光路如图 6所示。所用的光学显微镜为OLYPUS BX51,显微物镜的数值孔径(numerical cperture, NA)为0.9,放大倍数为100×。实验中利用反射模式,中心波长为600nm的卤素灯作为光源; 显微镜的极限分辨率为406.6nm; 线宽为200nm、间隔为100nm的蓝光光盘作为被测对象。通过扫描电子显微镜(scanning electron microscopy, SEM)测得的蓝光光盘的结构如图 7a所示。由于蓝光光盘尺寸小于显微镜的极限分辨率,直接在显微镜下观察不到蓝光光盘的细节信息如图 7b所示。从仿真结果图 4可知, 折射率为1.46、半径为5μm的二氧化硅微球与折射率为2、半径为26.5μm的钛酸钡微球产生的光喷射尺寸相近,且都小于折射率为1.46、半径为26.5μm的二氧化硅微球。为了得到大视场的超分辨率成像,实验研究中所选用的微球参量为折射率为2、半径为26.5μm的钛酸钡微球,微球直接在显微镜下的成像如图 7c所示。在实验前将蓝光光盘上面的保护膜去掉,并将微球用去离子水稀释后,滴到蓝光光盘的表面上,等水蒸发完后,将微球半浸没在无水的乙醇溶液中。
![Figure 6. The light path diagram of the microsphere-based far-field super-resolution imaging system]() Figure 6. The light path diagram of the microsphere-based far-field super-resolution imaging system
Figure 6. The light path diagram of the microsphere-based far-field super-resolution imaging system![Figure 7. The imaging results of the blu-ray disc]() Figure 7. The imaging results of the blu-ray disca—the image of the blu-ray disc by SEM b—the image of the blu-ray disc by optical microscopy c—the image of microsphere by optical microscopy& d—the image of the blu-ray disc by microsphere-based microscopy e—the magnified rectangle area marked with solid blue line in Fig.7d
Figure 7. The imaging results of the blu-ray disca—the image of the blu-ray disc by SEM b—the image of the blu-ray disc by optical microscopy c—the image of microsphere by optical microscopy& d—the image of the blu-ray disc by microsphere-based microscopy e—the magnified rectangle area marked with solid blue line in Fig.7d通过微球结合光学显微镜的成像系统得到蓝光光盘的像如图 7d所示。图 7e为图 7d方框区域的放大图。从图 7e可以看出, 蓝光光盘的细节信息被清晰分辨。实验结果说明, 实验中加入微球后可将携带物体细节信息的倏逝波转换成传输波参与远场成像,实现了样品的超分辨率成像。
4. 结论
针对对微纳结构元器件结构检测精度高、速度快的需求,设计了一套基于微球与传统光学显微镜相结合的远场超分辨率成像系统,并分析了该成像系统的实现远场超分辨率成像的物理机理。利用微球对平行光产生光纳米喷射的特性,将携带物体高频细节信息的倏逝波转换成传输波,然后传输波通过显微物镜在光电探测器处成像实现远场超分辨成像;实验中实现了对蓝光光盘的远场超分辨率成像,获得了100nm的分辨率。由于微球具有球对称性,其可以实现各个方向的超分辨率成像。
该成像方法具有系统结构简单、成本低等优点,可以应用于对微纳元件结构的检测、光刻技术、生物医学等领域。
-
![]()
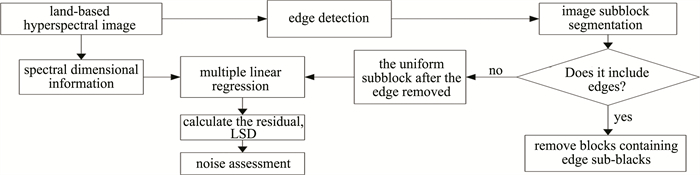
图 1 基于边缘剔除的RLSD噪声评估方法流程图
Figure 1. Flow chart of RLSD noise assessment method based on edge elimination
![]()
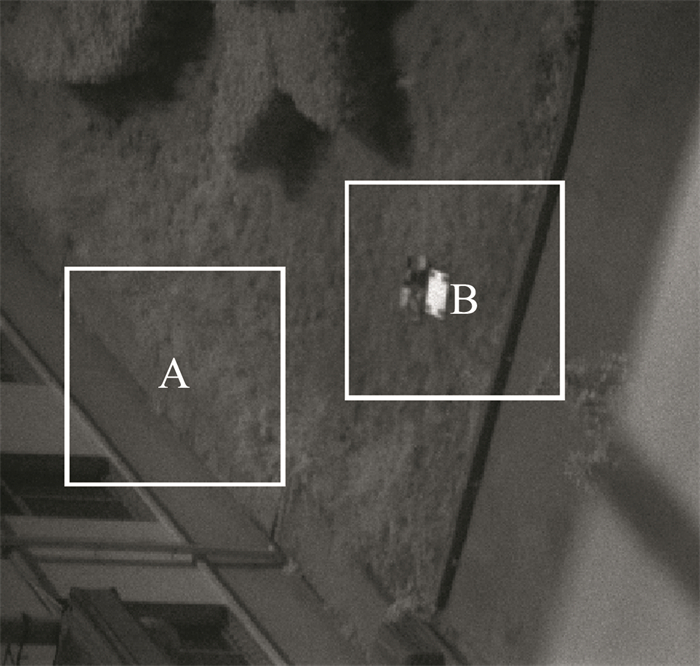
图 5 A、B两区域在不同分块条件下4种方法的噪声评价值
a—区域A在4×4分块下的4种方法的噪声估计值b—区域B在4×4分块下的4种方法的噪音估计值c—区域A在8×8分块下的4种方法的噪声估计值d—区域B在8×8分块下的4种方法的噪声估计值
Figure 5. Noise evaluation value of four methods under different block conditions for two regions A and B
a—estimation results of four noise assessment methods under 4×4 block in area A b—estimation results of four noise assessment methods under 4×4 block in area B c—estimation results of four noise assessment methods under 8×8 block in area A d—estimation results of four noise assessment methods under 8×8 block in area B
![]()
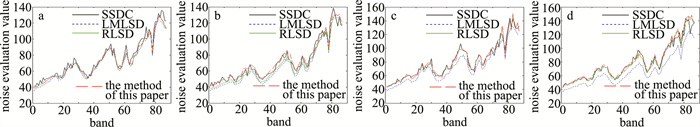
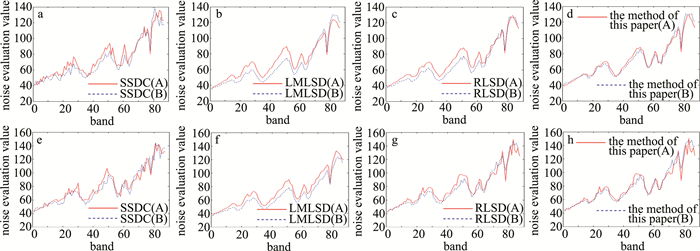
图 6 在4×4分块与8×8分块下, 采用不同方法时A、B两区域的噪声评估值
a—在4×4分块下SSDC方法的噪声评估值b—在4×4分块下LMLSD方法的噪声评估值c—在4×4分块下RLSD方法的噪声评估值d—在4×4分块下本文中方法的噪声评估值e—在8×8分块下SSDC方法的噪声评估值f—在8×8分块下LMLSD方法的噪声评估值g—在8×8分块下RLSD方法的噪声评估值h—在8×8分块下本文中方法的噪声评估值
Figure 6. Different methods are used to evaluate the noise values of A and B regions under 4×4 block and 8×8 block
a—noise evaluation value of SSDC method under 4×4 block b—noise evaluation value of LMLSD method under 4×4 block c—noise evaluation value of RLSD method under 4×4 block d—noise evaluation value of the method in this paper under 4×4 block e—noise evaluation value of SSDC method under 8×8 block f—noise evaluation value of LMLSD method under 8×8 block g—noise evaluation value of RLSD method under 8×8 block h—noise evaluation value of the method in this paper under 8×8 block
表 1 边缘剔除前后的子块数
Table 1 Number of subblocks before and after edge elimination
area A 4×4 block area A 8×8 block area B 4×4 block area B 8×8 block before edge elimination 6400 1600 6400 1600 after edge elimination 6105 1476 5994 1416  下载: 导出CSV
表 2 不同方法估计两个子图噪声的误差值
Table 2 Estimation error of two subgraphs noise using different methods
the method of this paper SSDC LMLSD RLSD deviation of noise estimate(4×4 block) 1.985×10³ 4.000×10³ 5.377×10³ 3.600×10³ deviation of noise estimate(8×8 block) 2.197×10³ 4.444×10³ 5.007×10³ 3.769×10³
下载: 导出CSV
-
[1] 孙俊, 靳海涛, 芦兵, 等. 基于高光谱图像及深度特征的大米蛋白质含量预测模型[J]. 农业工程学报, 2019, 35(15): 295-303. DOI: 10.11975/j.issn.1002-6819.2019.15.036 SUN J, JIN H T, LU B, et al. Prediction model of rice protein content based on hyperspectral image and depth characteristics[J]. Transactions of the Chinese Society of Agricultural Engineering, 2019, 35(15): 295-303(in Chinese). DOI: 10.11975/j.issn.1002-6819.2019.15.036
[2] 严阳, 华文深, 张炎, 等. 可见-近红外高光谱伪装目标特性分析[J]. 红外技术, 2019, 41(2): 171-175. https://www.cnki.com.cn/Article/CJFDTOTAL-HWJS201902011.htm YAN Y, HUA W Sh, ZHANG Y, et al. Visible near-infrared hyperspectral camouflage target characteristic analysis[J]. Infrared Technology, 2019, 41(2): 171-175(in Chinese). https://www.cnki.com.cn/Article/CJFDTOTAL-HWJS201902011.htm
[3] 董月群, 冒建华, 梁丹, 等. 城市河道无人机高光谱水质监测与应用[J]. 环境科学与技术, 2021, 44(s1): 289-296. DONG Y Q, MAO J H, LIANG D, et al. Monitoring and application of unmanned aerial vehicle hyperspectral water quality in urban river[J]. Environmental Science and Technology, 2021, 44(s1): 289-296(in Chinese).
[4] 邱纯, 白廷柱, 张硕, 等. 景物近红外反射率快速反演测量研究[J]. 红外技术, 2018, 40(2): 107-113. QIU Ch, BAI T Zh, ZHANG Sh, et al. Fast inversion measurement of near-infrared reflectance of scene[J]. Infrared Technology, 2018, 40(2): 107-113(in Chinese).
[5] 叶珍, 白璘, 何明一. 高光谱图像空谱特征提取综述[J]. 中国图象图形学报, 2021, 26(8): 1737-1763. https://www.cnki.com.cn/Article/CJFDTOTAL-ZGTB202108003.htm YE Zh, BAI L, HE M Y. A review on spatial spectrum feature extraction from hyperspectral images[J]. Journal of Image and Gra-phics, 2021, 26(8): 1737-1763 (in Chinese). https://www.cnki.com.cn/Article/CJFDTOTAL-ZGTB202108003.htm
[6] 张兵. 高光谱图像处理与信息提取前沿[J]. 遥感学报, 2016, 20(5): 1062-1090. https://www.cnki.com.cn/Article/CJFDTOTAL-YGXB201605032.htm ZHANG B. Advancement of hyperspectral image processing and information extraction[J]. Journal of Remote Sensing, 2016, 20(5): 1062-1090 (in Chinese). https://www.cnki.com.cn/Article/CJFDTOTAL-YGXB201605032.htm
[7] 严阳, 华文深, 刘恂, 等. 高光谱解混方法研究[J]. 激光技术, 2018, 42(5): 692-698. DOI: 10.7510/jgjs.issn.1001-3806.2018.05.020 YAN Y, HUA W Sh, LIU X, et al. Research of hyperspectral unmixing methods[J]. Laser Technology, 2018, 42(5): 692-698 (in Chinese). DOI: 10.7510/jgjs.issn.1001-3806.2018.05.020
[8] 童庆禧, 张兵, 张立福. 中国高光谱遥感的前沿进展[J]. 遥感学报, 2016, 20(5): 689-707. https://www.cnki.com.cn/Article/CJFDTOTAL-YGXB201605003.htm TONG Q X, ZHANG B, ZHANG L F. Current progress of hyper-spectral remote sensing in China[J]. Journal of Remote Sensing, 2016, 20(5): 689-707 (in Chinese). https://www.cnki.com.cn/Article/CJFDTOTAL-YGXB201605003.htm
[9] 张立福, 鹿旭晖, 岑奕, 等. 高光谱图像空间光谱维去相关噪声评估[J]. 遥感学报, 2021, 25(7): 1411-1421. https://www.cnki.com.cn/Article/CJFDTOTAL-YGXB202107005.htm ZHANG L F, LU X H, CEN Y, et al. Optimized spatial and spectral decorrelation method for noise estimation in hyperspectral images[J]. Journal of Remote Sensing, 2021, 25(7): 1411-1421 (in Chinese). https://www.cnki.com.cn/Article/CJFDTOTAL-YGXB202107005.htm
[10] 高连如, 张兵, 张霞, 等. 基于局部标准差的遥感图像噪声评估方法研究[J]. 遥感学报, 2007, 11(2): 201-208. GAO L R, ZHANG B, ZHANG X, et al. Study on the method for estimating the noise in remote sensing images based on local standard deviations[J]. Journal of Remote Sensing, 2007, 11(2): 201-208 (in Chinese).
[11] GAO L R, ZHANG B, ZHANG X, et al. A new operational method for estimating noise in hyperspectral images[J]. IEEE Geo Science and Remote Sensing Letters, 2008, 5(1): 83-87.
[12] 陈秋林, 薛永祺. OMIS成像光谱数据信噪比的估算[J]. 遥感学报, 2000, 4(4): 284-289. https://www.cnki.com.cn/Article/CJFDTOTAL-YGXB200004007.htm CHEN Q L, XUE Y Q. Estimation of signal-noise-ratio from data acquired with OMIS[J]. Journal of Remote Sensing, 2000, 4(4): 284-289(in Chinese). https://www.cnki.com.cn/Article/CJFDTOTAL-YGXB200004007.htm
[13] 蒋青松, 王建宇. 实用型模块化成像光谱仪多光谱图像的信噪比估算及压缩方法研究[J]. 光学学报, 2003, 23(11): 1335-1340. https://www.cnki.com.cn/Article/CJFDTOTAL-GXXB200311013.htm JIANG Q S, WANG J Y. Study on signal-to-noise ratio estimation and compression method of operational modular imaging spectrometer multi-spectral images[J]. Acta Optica Sinica, 2003, 23(11): 1335-1340 (in Chinese). https://www.cnki.com.cn/Article/CJFDTOTAL-GXXB200311013.htm
[14] 朱博, 王新鸿, 唐伶俐, 等. 光学遥感图像信噪比评估方法研究进展[J]. 遥感技术与应用, 2010, 25(2): 303-309. https://www.cnki.com.cn/Article/CJFDTOTAL-YGJS201002022.htm ZHU B, WANG X H, TANG L L, et al. Review on methods for SNR estimation of optical remote sensing imagery[J]. Remote Sensing Technology and Application, 2010, 25(2): 303-309 (in Chinese). https://www.cnki.com.cn/Article/CJFDTOTAL-YGJS201002022.htm
[15] 余谭其, 韦玮, 张艳娜, 等. 敦煌辐射校正场春季BRDF特性分析[J]. 光子学报, 2018, 47(6): 612004. YU T Q, WEI W, ZHANG Y N, et al. Analysis of the BRDF characteristics of Dunhuang Radiometric Correction Site in the Spring[J]. Acta Photonica Sinica, 2018, 47(6): 612004 (in Chinese).
[16] 薛武, 张永生, 董广军, 等. Canny算子子像素边缘检测方法[J]. 遥感信息, 2013, 28(1): 8-10. https://www.cnki.com.cn/Article/CJFDTOTAL-YGXX201301002.htm XUE W, ZHANG Y Sh, DONG G J, et al. An edge-detection method of sub-pixel based on Canny operator[J]. Remote Sensing Information, 2013, 28(1): 8-10(in Chinese). https://www.cnki.com.cn/Article/CJFDTOTAL-YGXX201301002.htm
[17] 傅鹏, 孙权森, 纪则轩. 基于光谱-空间信息的高光谱遥感图像混合噪声评估[J]. 红外与毫米波学报, 2015, 34(2): 236-242. FU P, SUN Q S, JI Z X. A spectral-spatial information based approach for the mixed noise estimation from hyperspectral remote sensing images[J]. Journal of Infrared and Millimeter Waves, 2015, 34(2): 236-242(in Chinese).
-
期刊类型引用(1)
1. 周健文,姚纳,赵汗青,张云凡,焦蛟,孙旭,伍波. 大气湍流下超振荡望远成像的理论研究. 激光技术. 2023(01): 115-120 .  本站查看
本站查看
其他类型引用(0)


计量
- 文章访问数: 563
- HTML全文浏览量: 0
- PDF下载量: 5
- 被引次数: 1