
Forming quality control method of laser cladding Fe-based TiC composite coating
-
摘要: 为了揭示激光熔覆工艺参数对铁基TiC复合熔覆层成形质量的作用规律、优化激光熔覆工艺参数,使用YAG固体激光器在60Si2Mn基体上激光熔覆铁基TiC复合涂层,基于响应面法建立输出电流、脉冲宽度、扫描速率与熔覆层宽度、高度、熔池深度、宽高比、稀释率以及硬度之间的数学模型,并对模型进行方差分析,获得了工艺参数与成形质量之间的函数关系。结果表明,输出电流和脉冲宽度对涂层宽度具有正相关性,扫描速率与涂层宽度成反比;扫描速率对熔覆层高度和熔池深度没有显著性影响;涂层宽度与高度的比值随着输出电流的增大而增大;输出电流对涂层稀释率影响最为显著,脉冲宽度次之;较高的输出电流和较大的扫描速率能够得到高硬度涂层;经优化验证模型的误差均小于5%。该研究结果能够用于铁基陶瓷复合涂层成形质量的预测及优化激光工艺参数。Abstract: In order to reveal the effect of laser cladding process parameters on the forming quality of Fe based TiC composite cladding layer and optimize the laser cladding process parameters, a YAG solid-state laser was used to achieve laser cladding Fe-based TiC composite coating on 60Si2Mn substrate, and a mathematical model was established to study the influence of output current, pulse width, and scanning speed on cladding width, height, molten pool depth, aspect ratio, dilution rate, and hardness based on response surface method. Then the mathematical model was analyzed by variance analysis. And the functional relationship between process parameters and molding quality was obtained. The results show that the output current and pulse width have a positive correlation with the coating width, and the scanning speed is inversely proportional to the coating width; The scanning speed has no significant effect on the height of cladding layer and the depth of molten pool; The ratio of coating width to coating height increases with the increase of output current; The output current has the most significant effect on the coating dilution ratio, followed by the pulse width; High hardness can be obtained with higher output current and scanning speed; The error of the optimized model is less than 5%. The results can be used to predict the forming quality of Fe based ceramic composite coating and optimize the laser processing parameters.
-
引言
高能脉冲激光器指的是具有较大的输出功率、每间隔一定时间发出一个或多个激光脉冲(宽度通常小于250ms)的激光器,广泛应用于毁伤、焊接、烧蚀等应用场合[1-2]。高能脉冲激光器具有较高的亮度,通常采用脉冲氙灯作为激光源,其工作原理是利用储能驱动装置储存的电能对高能脉冲氙灯进行放电激发,储能驱动装置产生的近矩形的驱动电流波形可以激励脉冲氙灯获得稳定的高亮度,同时也可以精确控制脉冲氙灯的放电过程[3]。目前,国内外氙灯驱动装置主要采用脉冲成形网络(pulsed forming network, PFN)来存储初始能量,并通过调节脉冲驱动电流的波形来满足实际应用需求[4]。
近年来,LIU等人研究了PFN的波形构造和精确触发控制[5-10]; TANG等人研究了PFN电路的时序控制[11]; SCHOLFIELD等人讨论了真空状态下PFN的放电特性[12]; LI等人研究了氙灯的放电特性和建模[13-15]。尽管对PFN和脉冲氙灯已经做了大量研究工作,实践中仍然存在一些局限,如增加PFN网络节数可以有效改善波形[16],但由于重量和体积的约束,过多的网络节数可能不能接受;由于PFN放电过程短暂[17],在很多模型和分析中,氙灯的阻抗都被等效为恒定不变的阻值,而在工程设计和实际的应用中,氙灯阻抗总是随导通电流的改变而动态改变[18],且阻抗的这种变化会影响PFN放电过程和放电特性[19]。因此,建立包含这种氙灯放电特性的驱动电路模型,并将PFN和高能脉冲氙灯结合成为一个整体,结合工程化进行放电特性的研究,可以更加真实地反映驱动电路的工作特性,并且有利于进一步推动高能脉冲氙灯驱动电路的工程应用及拓展。
本文中简述了PFN的基本原理和脉冲氙灯的放电特性,探讨了电气参数的计算,通过仿真分析了PFN节数、首末电感、网络电感等电气参数对脉冲电流波形的影响,并分析了PFN节数对工程实现的影响。
1. 基本组成
本文中阐述的高能脉冲氙灯储能驱动装置由PFN线路和脉冲氙灯两部分构成。其工作原理为脉冲氙灯点火后,经充电的PFN网络对脉冲氙灯进行短时大电流放电,产生高功率、高亮度的激光。
1.1 脉冲形成网络
脉冲成形网络是将R-L-C 3种无源器件根据一定的规则形成电路组元,利用各组元放电波形的叠加形成满足实际应用需要的电流波形[20]。PFN有3种类型:一类是根据雷利法则设计而来;另外的两种类型分别是基于导纳函数的有理分式和传输线阻抗函数展开[21]。其中雷利脉冲成形网络由多个电路拓扑结构相同的电路组元串联而成,如图 1所示。由于雷利脉冲成形网络每个电路组元的电容、电感参数一致,能实现类似方波的脉冲电流输出,且在工程应用上方便实现,使其成为脉冲功率应用领域的主要网络形式[22]。
网络阻抗Z为:
Z=√LΣCΣ (1) 式中, L∑表示网络中各电感之和,C∑表示网络中各电容之和。
由于放电开始时刻的电感电流为0,网络中的能量全部保存在电容中,网络中的能量为:
EΣ=12CΣU2 (2) 式中, U是放电开始时刻电容两端的电压。
1.2 脉冲氙灯的放电特性
脉冲氙灯由加在电极的高压于轴向形成强电场后,在触发脉冲作用下,灯管气体进入类稳放电阶段[23],此时氙灯的等离子体电阻率可用下式表示:
ρ=K1j−1/2 (3) 式中, K1为等离子体电阻率系数;j为电流密度。
此时脉冲氙灯电压-电流变化规律用下式描述:
V=V_{\mathrm{AK}}+\rho I \frac{4 l}{{\rm{ \mathsf{ π} }} d^{2}} (4) 式中, VAK是电极位降;V和I是氙灯瞬时电压和瞬时电流;l和d是氙灯的弧长和直径。
将(3)式代入(4)式,忽略20V左右的电极位降VAK后[24],脉冲氙灯的电压-电流特性方程用下式描述:
V=K_{0} I^{1 / 2} (5) 式中, 氙灯系数K0=2K1l/( d\sqrt {\rm{ \mathsf{ π} }} )。
K0在理论上只与氙灯内的气体类型和气压有关,目前常用的经验公式首先由GONZE提出:
K_{0}=1.28 \frac{l}{d}\left(\frac{p}{450}\right)^{1 / 5} (6) 式中, p为氙灯内放电前气体压强。
脉冲氙灯的等效阻抗为:
R_{\mathrm{DC}}=K_{0} I^{-1 / 2} (7) 脉冲氙灯的放电能量为:
E=T_{\mathrm{p}} I_{\mathrm{m}}{ }^{2} R_{\mathrm{DC}} (8) 式中, Tp为氙灯放电脉冲宽度,Im为平均电流。
将(7)式代入(8)式可得:
E=T_{\mathrm{p}} K_{0} I^{3 / 2} (9) I_{\mathrm{m}}=\left(\frac{E}{T_{\mathrm{p}} K_{0}}\right)^{2 / 3} (10) R_{\mathrm{DC}}=K_{0}^{4 / 3}\left(\frac{E}{T_{\mathrm{p}}}\right)^{-1 / 3} (11) 2. 电路仿真及结果分析
2.1 电路参数计算与仿真
根据放电网络的阻抗与负载(脉冲氙灯)的阻抗匹配进行电阻参数的计算与仿真,设:
Z=k R_{\mathrm{DC}} (12) 式中, k是阻抗匹配系数。
由于E=E∑, 联立(1)式、(2)式、(9)式、(10)式、(11)式可得:
C_{\Sigma}=\frac{2 T_{\mathrm{p}}{}^{2 / 3} E^{1 / 3}}{(1+k)^{2} K_{0}{}^{4 / 3}} (13) L_{\Sigma}=\frac{2 k^{2}}{(1+k)^{2}} T_{\mathrm{p}}{}^{4 / 3} E^{-1 / 3} K_{0}{}^{4 / 3} (14) U=(1+k)\left(\frac{E}{T_{\mathrm{p}}}\right)^{1 / 3} K_{0}{}^{2 / 3} (15) 建立电路仿真模型如图 2所示,图中f(u)是激励函数。
以某型产品为例,计算电路参数并进行放电特性仿真。仿真中,放电能量E=10000J,氙灯放电脉冲宽度Tp=1.2ms,氙灯特性系数K0=61.38Ω·A1/2,根据阻抗匹配系数计算电路参数,如表 1所示。
Table 1. Circuit parameters with different k valuesk C∑/μF L∑/μH U/V 1.25 399.97 885.06 7071 1 506.21 716.03 6285 0.75 661.18 519.64 5499 0.5 899.86 318.13 4714 0.25 1322.24 117.14 3889 为不失一般性,设置放电网络的节数n=4,仿真结果如图 3所示。
由图 3可知,k>1时, 驱动电流会产生反向过冲现象,危害氙灯运行安全; k < 0.75时, 驱动电流下降沿会产生震荡现象,影响氙灯光电转换效率。k的理想设置区间为0.75~1。
2.2 节数n对放电波形的影响
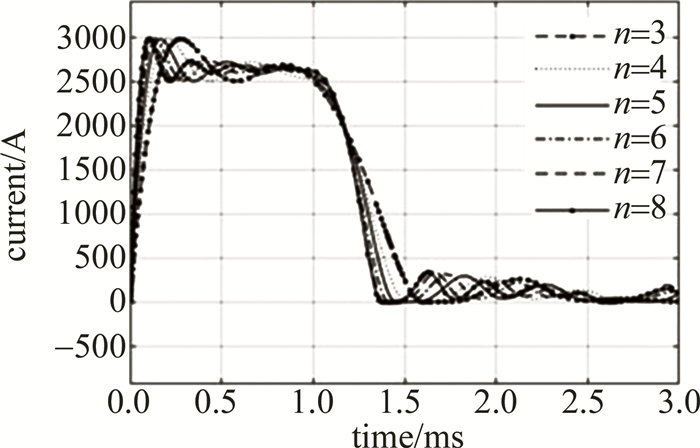
对2.1节中某型产品k=0.75的情况,保持C∑和L∑不变,开展不同节数n的仿真分析,设置节数n分别为3,4,5,6,7,8,网络中电容和电感均相同,仿真结果如4图所示,波形数据如表 2所示。
Table 2. Influence of node on discharge waveformn rise time/
μsfall time/
μseffective pulse width/μs wave crest/
A3 136 518 916 2974 4 103 405 978 2974 5 83 352 1001 2974 6 67 307 1021 2974 7 58 270 1035 2974 8 52 245 1048 2974 由图 4和表 2可知,当网络节数越大时,脉冲波形前后沿越陡峭,变化速度越快,但节数从6增加到8时,脉冲前沿和后沿变化率的变化幅度远不如节数从3增加到5的大。随着节数的增多,放电电流波形中的波峰和波谷数量也越多,且数量和节数相同,而波峰和波谷的幅值依次减小。可以预见,当节数越多时,所产生的放电电流波形越接近矩形。在放电时,无论节数有多少,放电电流波形中的第1个波峰均会出现较为明显的过冲,且波峰的幅值不受节数的影响。
2.3 节数n对工程实现的影响
对2.1节中某型产品k=0.75的情况,保持C∑和L∑不变,开展不同节数n的工程实现分析,设置节数n分别为3,4,5,6,7,8,网络中电容和电感均相同,工程实现后的体积、重量和失效率如表 3所示。
Table 3. Engineering parameters at different noden total volume/
cm3total weight/
kgfailure rate/
(10-6h-1)3 101284 25.6 0.9370 4 115484 31.2 1.2493 5 133339 37.2 1.5617 6 148436 43.0 1.8740 7 154525 47.5 2.1864 8 158306 51.8 2.4987 在实际工程应用中,电容和电感往往采用一体化设计,经脉冲成形电路的各元件封装在一个箱体内,设计结果显示,产品的体积、重量和失效率均随着网络节数的增加而近似线性增加,其中失效率随着网络节数的增加而成比例的增加,因此,最终在确定电路结构时应考虑安装空间、重量以及任务可靠度的要求,综合考虑各约束条件来选择网络节数,以满足工程实现要求。
2.4 首链电感对放电波形的影响
对首链的电感值进行加权,为不失一般性,设网络节数n=4,则:
L_{2}=L_{3}=L_{4}=L (16) L_{1}=q_{1} L (17) L_{\Sigma}=L_{1}+L_{2}+L_{3}+L_{4} (18) 设置首链电感加权值q1为1.8,1.6,1.4,1.2,1,0.8,仿真结果如图 5和表 4所示。
Table 4. Influence of inductance weighted value of leading chain on waveformn rise time/
μsfall time/
μseffective pulse width/μs wave crest/
Aovershoot amplitude/% 0.8 85 408 995 3102 17.37 1 103 405 978 2974 12.52 1.2 120 402 963 2877 8.85 1.4 143 416 953 2782 5.26 1.6 152 416 936 2772 4.88 1.8 168 442 920 2746 3.40 由图 5和表 4可知,首链电感的电感值改变对放电电流波形第1个波峰的影响较大,减小首链电感的电感值可使上升沿变快,但会使波峰的过冲加剧,且第1个波峰后会跟随有震荡,增大首链电感的电感值可抑制波峰的过冲,但会改变上升时间和下降时间,将首链电感加权至1.2时可明显抑制过冲,加权至1.6以上时抑制过冲不再明显,且上升时间和下降时间显著增加。因此,首链电感加权值的理想取值区间为1.2~1.4。
2.5 末链电感对放电波形的影响
对首链的电感值进行加权,为不失一般性,设网络节数n=4,则:
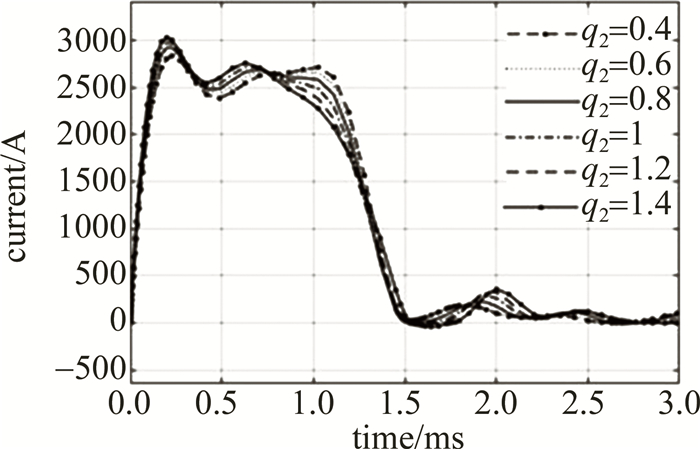
L_{1}=L_{2}=L_{3}=L (19) L_{4}=q_{2} L (20) L_{\Sigma}=L_{1}+L_{2}+L_{3}+L_{4} (21) 设置末链电感加权值q2为1.4,1.2,1,0.8,0.6,0.4,仿真结果如图 6和表 5所示。
Table 5. Influence of inductance weighted value of end chain on waveformn rise time/
μsfall time/
μseffective pulse
width/μswave
crest/Aovershoot
amplitude/%0.4 124 322 1038 2831 7.11 0.6 116 324 1028 2880 8.97 0.8 109 345 1011 2924 10.63 1 103 405 978 2974 12.52 1.2 98 446 931 3019 14.23 1.4 97 547 858 3028 14.57 由图 6和表 5可知,末链电感的电感值改变对放电电流波形第1个波峰影响较小,减小末链电感的电感值可使下降沿变宽,有效脉宽小幅度变宽,但也会小幅度增加上升时间。因此,末链电感加权值的理想取值点在0.8附近。
3. 结论
本文中从工程实现的角度分析了脉冲成形网络的电路结构以及电感、电容参数计算,基于氙灯的放电特性,建立了仿真模型,通过仿真分析了影响脉冲波形的因素,并分析了电路结构对工程实现的影响程度。
在实际设计过程中,要综合考虑性能指标要求,以及体积、重量、失效率等应用要求,来确定PFN节数,节数越多,脉冲波形越接近矩形,但同时产品的体积和重量更大,失效率更高。改变首链和末链电感值可以调节放电电流波形的波峰和波谷幅值,并可以微调前后沿波形,但波峰最高幅值和脉冲前后沿两个指标只能平衡,不可兼得,因此,在工程应用中应结合需求,综合考虑,合理调整电路中的各个参数。
-
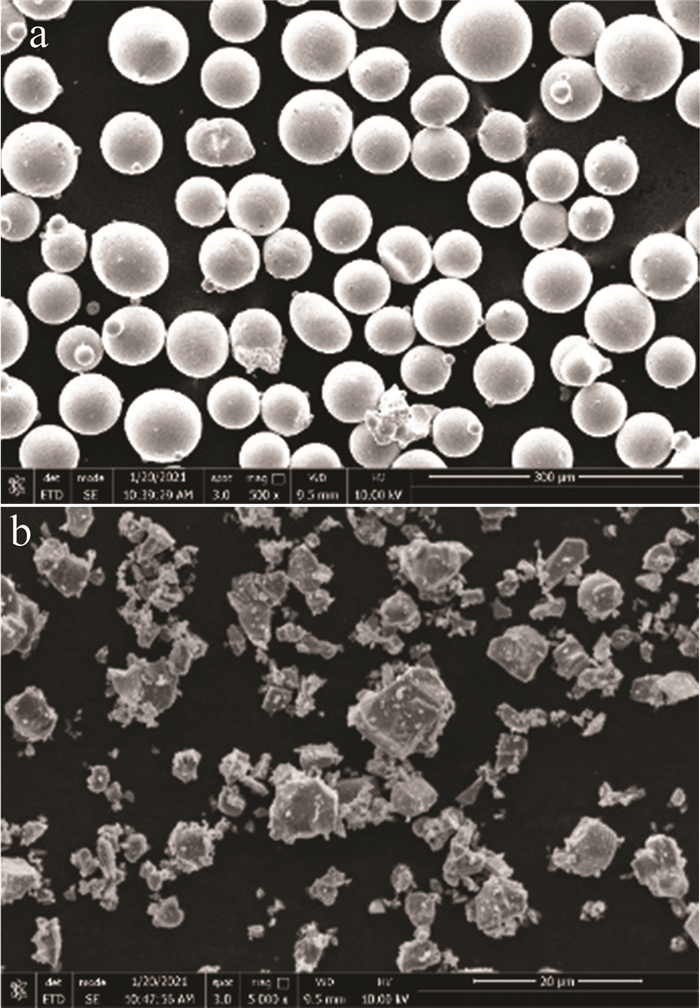
![]()
Figure 1. Scanning electron microscope micrograph of the cladding powder
a—Fe60 powder b—TiC ceramic powder
![]()
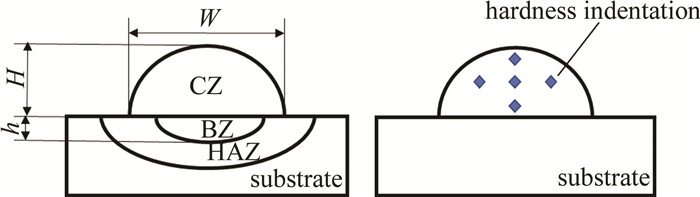
Figure 2. Diagram of section morphology and hardness indentation of the cladding layer
![]()
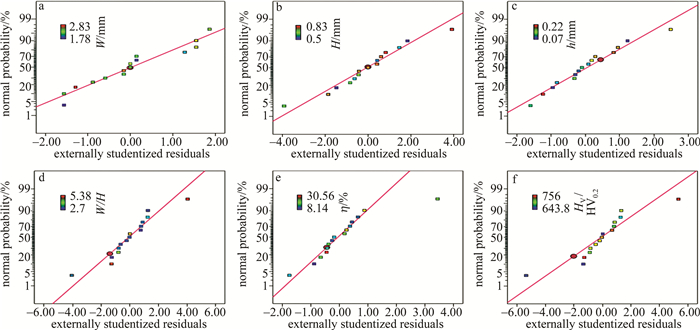
Figure 3. Response target residual normal distribution diagram
a—width b—height c—depth d—aspect ratio e—dilution rate f—hardness
![]()
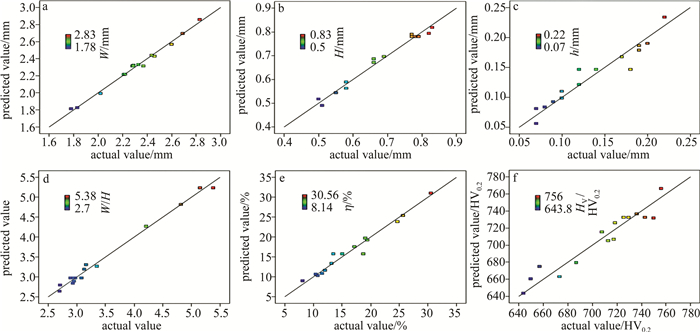
Figure 4. The predicted and actual values of the response target
a—width b—height c—depth d—aspect ratio e—dilution rate f—hardness
![]()
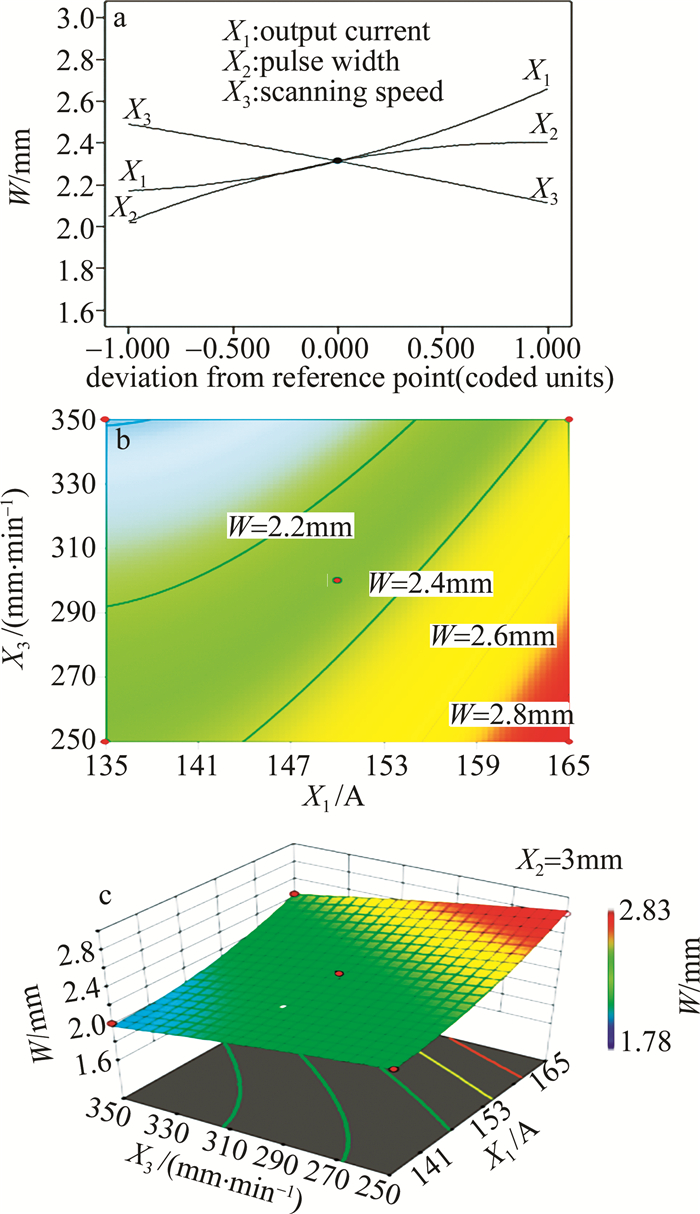
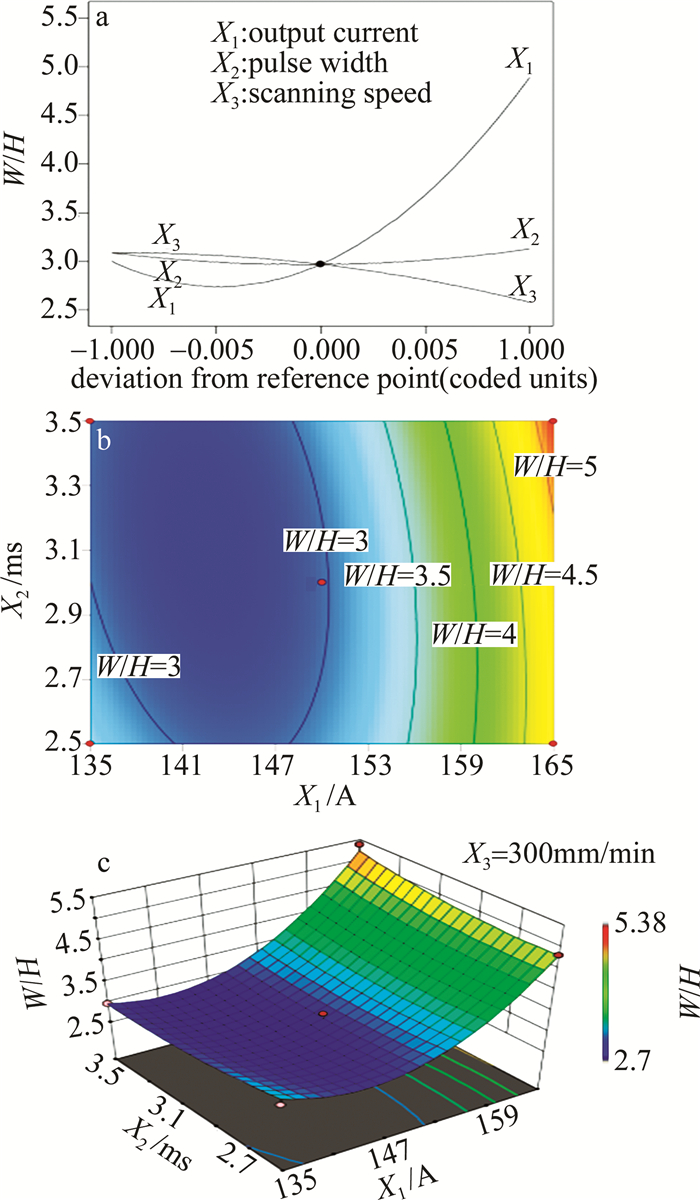
Figure 5. Relationship between process parameters and cladding layer width
a—perturbation diagram b—contour diagram c—3-D response curve diagram
![]()
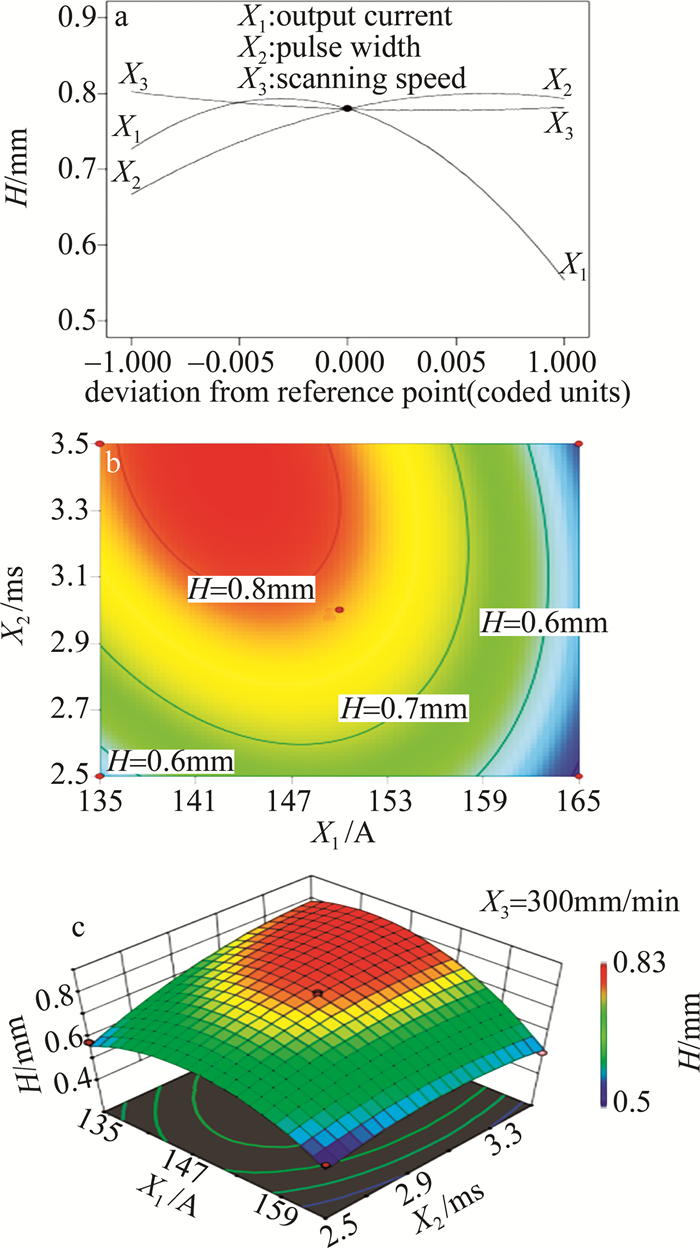
Figure 6. Relationship between process parameters and cladding layer height
a—perturbation diagram b—contour diagram c—3-D response curve diagram
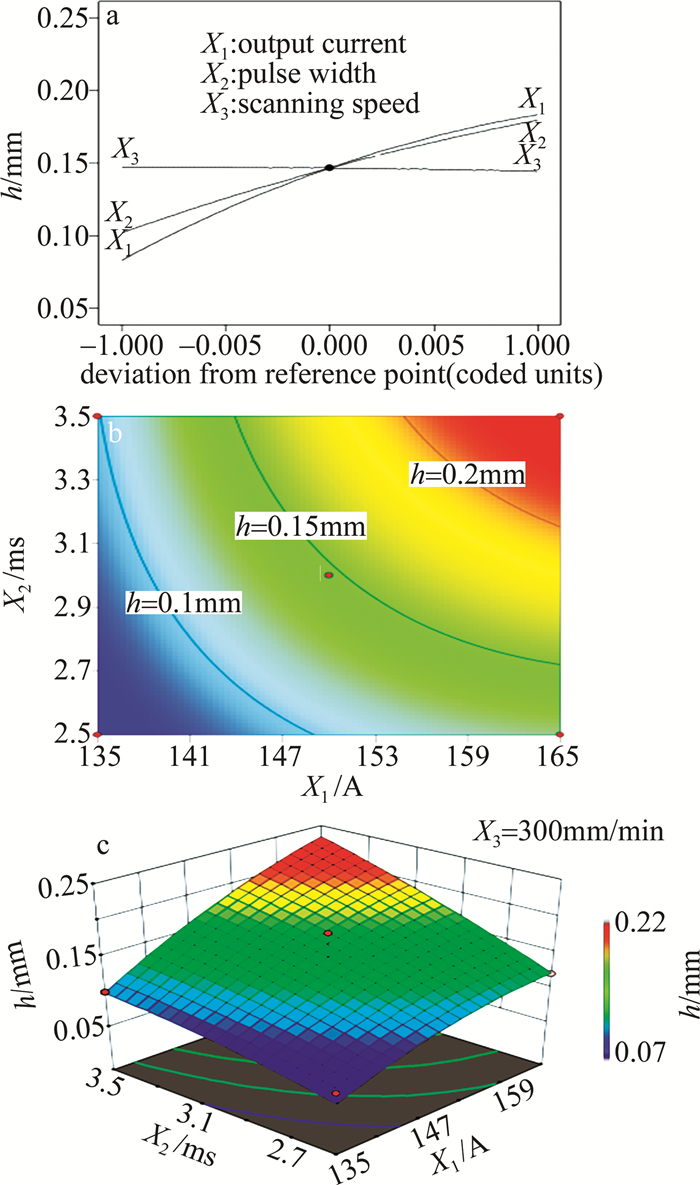
![]()
Figure 7. Relationship between process parameters and molten pool depth
a—perturbation diagram b—contour diagram c—3-D response curve diagram
![]()
Figure 8. Relationship between process parameters and aspect ratio
a—perturbation diagram b—contour diagram c—3-D response curve diagram
![]()
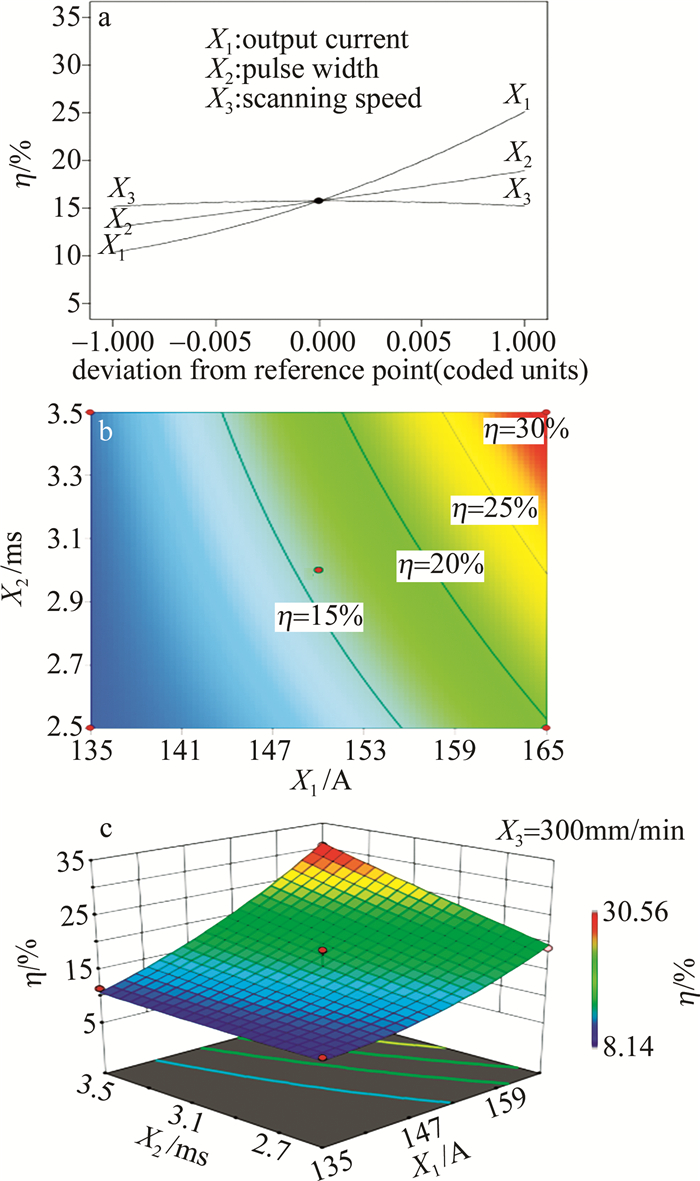
Figure 9. Relationship between process parameters and dilution rate
a—perturbation diagram b—contour diagram c—3-D response curve diagram
![]()
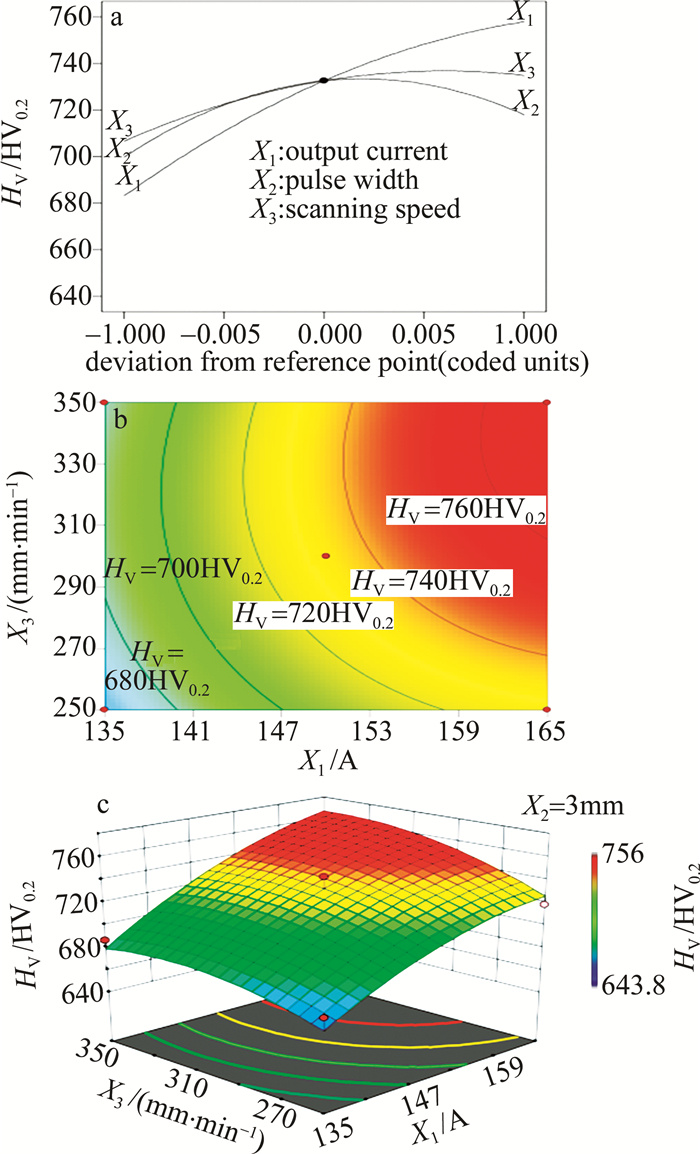
Figure 10. Relationship between process parameters and hardness of cladding layer
a—perturbation diagram b—contour diagram c—3-D response curve diagram
Table 1 Laser cladding process parameters and factor levels
level of factor -1 0 +1 X1/A 135 150 165 X2/ms 2.5 3.0 3.5 X3/(mm·min-1) 250 300 350  下载: 导出CSV
Table 2 Box-Behnken design test scheme and results
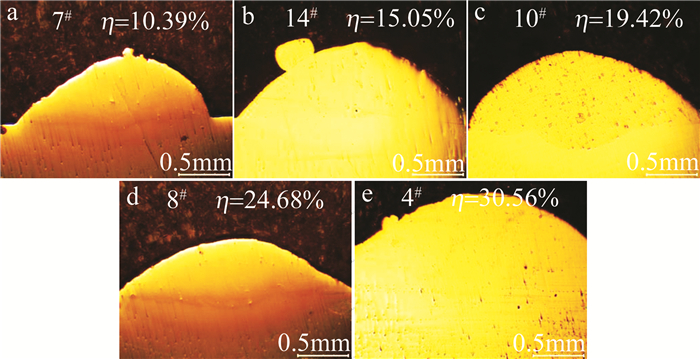
standard order factors responses X1/A X2/ms X3/(mm·min-1) W/mm H/mm h/mm W/H η/% HV/HV0.2 1# 135 2.5 300 1.83 0.58 0.07 3.16 10.77 643.8 2# 165 2.5 300 2.46 0.51 0.12 4.82 19.05 749.8 3# 135 3.5 300 2.29 0.77 0.1 2.97 11.49 657 4# 165 3.5 300 2.69 0.5 0.22 5.38 30.56 736.3 5# 135 3 250 2.33 0.79 0.07 2.95 8.14 673.3 6# 165 3 250 2.83 0.55 0.19 5.15 25.68 718.6 7# 135 3 350 2.02 0.69 0.08 2.93 10.39 686.8 8# 165 3 350 2.44 0.58 0.19 4.21 24.68 756 9# 150 2.5 250 2.21 0.66 0.09 3.35 12 649.8 10# 150 3.5 250 2.6 0.83 0.2 3.13 19.42 712.9 11# 150 2.5 350 1.78 0.66 0.1 2.7 13.16 707.8 12# 150 3.5 350 2.22 0.82 0.17 2.71 17.17 717.5 13# 150 3 300 2.37 0.77 0.12 3.08 13.48 729.5 14# 150 3 300 2.28 0.79 0.14 2.89 15.05 742.8 15# 150 3 300 2.29 0.78 0.18 2.94 18.75 725.5
下载: 导出CSV
Table 3 Chemical content of Fe60 powder(mass fraction)
specification C Si Cr Mn Fe Fe60 ≤0.0002 ≤0.01 0.14~0.18 ≤0.004 balance
下载: 导出CSV
Table 4 Analysis of variance of the cladding layer width
source sum of square model degree of freedom mean square F-value p-value model 1.15 9 0.13 61.63 0.0001 significant X1 0.48 1 0.48 229.80 < 0.0001 X2 0.29 1 0.29 139.63 < 0.0001 X3 0.29 1 0.29 137.80 < 0.0001 X12 0.039 1 0.039 19.06 0.0072 X22 0.036 1 0.036 17.56 0.0086 residual 0.010 5 2.068×10⁻³ lack of fit 5.475×10⁻³ 3 1.825×10⁻³ 0.75 0.6148 not significant pure error 4.867×10⁻³ 2 2.433×10⁻³ total 1.16 14 注:Rs=0.9911;Ap=28.175
下载: 导出CSV
Table 5 Analysis of variance of cladding layer height
source sum of square model degree of freedom mean square F-value p-value model 0.19 9 0.021 30.01 0.0008 significant X1 0.060 1 0.060 85.63 0.0002 X2 0.033 1 0.033 46.78 0.0010 X3 8.000×10⁻⁴ 1 8.000×10⁻⁴ 1.15 0.3324 X1X2 1.000×10⁻² 1 1.000×10⁻² 14.39 0.0127 X12 0.072 1 0.072 104.13 0.0002 X22 9.231×10⁻³ 1 9.231×10⁻³ 13.28 0.0148 residual 3.475×10⁻³ 5 6.950×10⁻⁴ lack of fit 3.275×10⁻³ 3 1.092×10⁻³ 10.92 0.0851 not significant pure error 2.000×10⁻⁴ 2 1.000×10⁻⁴ total 0.19 14 注:Rs=0.9818;Ap=15.273
下载: 导出CSV
Table 6 Analysis of variance of molten pool depth
source sum of square model degree of freedom mean square F-value p-value model 0.034 9 3.824×10⁻³ 6.97 0.0228 significant X1 0.020 1 0.020 36.47 0.0018 X2 0.012 1 0.012 21.91 0.0054 X3 1.250×10⁻⁵ 1 1.250×10⁻⁵ 0.023 0.8859 residual 2.742×10⁻³ 5 5.483×10⁻⁴ lack of fit 8.750×10⁻⁴ 3 2.917×10⁻⁴ 0.031 0.8197 not significant pure error 1.867×10⁻³ 2 9.333×10⁻⁴ total 0.037 14 注:Rs=0.9262;Ap=9.284
下载: 导出CSV
Table 7 Analysis of variance of cladding layer width to height ratio
source sum of square model degree of freedom mean square F-value p-value model 11.71 9 1.30 61.07 0.0001 significant X1 7.13 1 7.13 334.60 < 0.0001 X2 3.200×10⁻³ 1 3.200×10⁻³ 0.15 0.7142 X3 0.52 1 0.52 24.19 0.0044 X1X2 0.14 1 0.14 6.60 0.0500 X1X3 0.21 1 0.21 9.94 0.0253 X12 3.51 1 3.51 164.83 < 0.0001 residual 0.11 5 0.021 lack of fit 0.087 3 0.029 2.99 0.2604 not significant pure error 0.019 2 9.700×10⁻³ total 11.81 14 注: Rs=0.9910;Ap=21.790
下载: 导出CSV
Table 8 Analysis of variance of cladding layer diluton rate
source sum of square model degree of freedom mean square F-value p-value model 558.93 9 62.10 17.33 0.0029 significant X1 437.78 1 437.78 122.18 0.0001 X2 69.97 1 69.97 19.53 0.0069 X3 3.200×10⁻³ 1 3.200×10⁻³ 8.931×10⁻⁴ 0.9773 X1X2 29.11 1 29.11 8.12 0.0358 residual 17.92 5 3.58 lack of fit 3.27 3 1.09 0.15 0.9219 not significant pure error 14.64 2 7.32 total 576.84 14 注:Rs=0.9689;Ap=14.252
下载: 导出CSV
Table 9 Analysis of variance of cladding layer hardness
source sum of square model degree of freedom mean square F-value p-value model 17335.45 9 1926.16 6.53 0.0263 significant X1 11235.00 1 11235.00 38.07 0.0016 X2 657.03 1 657.03 2.23 0.1959 X3 1610.28 1 1610.28 5.46 0.0667 X22 2087.08 1 2087.08 7.07 0.0449 residual 1475.70 5 295.14 lack of fit 1311.64 3 437.21 5.33 0.1620 not significant pure error 164.06 2 82.03 total 18811.16 14 注: Rs=0.9216;Ap=8.754
下载: 导出CSV
Table 10 Optimization conditions and goals
name goal lower limits upper limits X1/A in range 135 165 X2/ms in range 2.5 3.5 X3/(mm·min-1) in range 250 350 W/H maximize 2.7 5.38 η/% 25 8.14 30.56 HV/HV0.2 maximize 643.8 756
下载: 导出CSV
Table 11 Optimization results and verification
number X1/A X2/ms X3/(mm·min-1) W/H η/% HV/HV0.2 desirability predict 165 3 296 4.922 25 756 0.939 selected 165 3 296 4.894 24.2 707.8 experimental 165 3 296 4.745 26.7 774.5 165 3 296 4.921 26.1 729.5 average error/% 1.5 4.8 4.1
下载: 导出CSV
-
[1] LI Y J, LI J N, WANG J, et al. Laser welding/cutting/cladding technology[M]. Beijing: Chemical Industry Press, 2016: 159-166(in Chinese).
[2] ZHANG J Ch, SHI Sh H, GONG Y Q, et al. Research progress of laser cladding technology[J]. Surface Technology, 2020, 49(10): 1-11(in Chinese). http://en.cnki.com.cn/Article_en/CJFDTOTAL-GWRC201703002.htm
[3] ZHU G X, ZHANG A F, LI D Ch. Effect of process parameters on surface smoothness in laser cladding[J]. Chinese Journal of Lasers, 2010, 37(1): 296-301(in Chinese). DOI: 10.3788/CJL20103701.0296
[4] LIU X B, WANG H M. The influence of processing param eters on laser cladd ing composite coatings on TiAl interm etallic alloy[J]. Laser Technology, 2006, 30(1): 66-69(in Chinese). http://en.cnki.com.cn/Article_en/CJFDTOTAL-JGJS200601019.htm
[5] YANG X H, ZHANG A F, LI D Ch, et al. Influence of process parameters on self-healing ability in laser metal direct forming[J]. Chinese Journal of Lasers, 2011, 38(6): 0603023(in Chinese). DOI: 10.3788/CJL201138.0603023
[6] CHEN Zh.Research of the process parameters optimization and properties for laser cladding Ti-Al based coatings on titanium alloy[D].Dalian: Dalian University of Technology, 2018: 2-9(in Chinese).
[7] YU G, HE X L, LI Sh X, et al. Laser manufacturing and its applications[M]. Beijing: National Defence Industry Press, 2016: 243-248(in Chinese).
[8] LI W P, CHEN T, LIU D F. Process parameters optimization of TiC/TiB composite ceramic coatingsIn-situ fabricated by laser cladding[J]. Hot Working Technology, 2021, 50(8): 92-96(in Chinese).
[9] CUI H Z.Study on TiC/Ni composite coating by laser cladding on aluminum alloy surface and its properties[D].Quanzhou: Huaqiao University, 2020: 1-13(in Chinese).
[10] BAX B, RAJPUT R, KELLET R, et al. Systematic evaluation of process parameter maps for laser cladding and directed energy deposition[J]. Additive Manufacturing, 2018, 21(3): 487-494.
[11] ZHANG J, WU W N, ZHAO L Zh. Research progress and development trend of laser cladding[J]. Hot Working Technology, 2013, 42(6): 131-134(in Chinese). http://en.cnki.com.cn/Article_en/CJFDTOTAL-SJGY201306041.htm
[12] XU Sh W, CHEN X Zh, SU Ch Ch, et al. Effect of processing parameters on quality of laser cladding layer[J]. Hot Working Technology, 2020, 49(22): 110-113(in Chinese).
[13] YU T B, SONG B X, XI W Ch, et al. Impact analysis on laser cladding process parameters of Fe-based alloy powder[J/OL].[2021-04-10].https://doi.org/10.14158/j.cnki.1001-3814.20181106(in Chinese).
[14] HUANG H B, SUN W L. Influence of laser cladding process para-meters on crack and thickness of Ni60[J]. Laser Technology, 2021, 45(6): 788-793(in Chinese).
[15] SUN Y W, HAO M Zh. Statistical analysis and optimization of process parameters in Ti6Al4V laser cladding using Nd∶YAG laser[J]. Optics & Lasers in Engineering, 2012, 50(7): 985-995. DOI: 10.1016/j.optlaseng.2012.01.018
[16] YAN R, LI H, LI J Ch, et al. Process parameters optimization of po-lystyrene powder selective laser sintering based on response surface methodology[J]. Chinese Journal of Lasers, 2019, 46(3): 0302015(in Chinese). DOI: 10.3788/CJL201946.0302015
[17] PAN L J, CHEN W F, ZHOU Y F, et al. Arameter optimization of laser-induced breakdown spectroscopy experimental device basedon response surface methhodogy[J]. Chinese Journal of Lasers, 2020, 47(9): 0911001(in Chinese). DOI: 10.3788/CJL202047.0911001
[18] QIN H F, CAO L, GAO J G, et al. Service life of PTFE coating on iron surface based on response surface methodology[J]. Surface Technology, 2017, 46(2): 133-137(in Chinese). http://en.cnki.com.cn/Article_en/CJFDTOTAL-BMJS201702021.htm
[19] MENG L L, ZHU Y H, ZENG Y S. Optimization of 2A97 Al-Li alloy chemical milling technology in response surface method[J]. Surface Technology, 2017, 46(7): 255-261(in Chinese). http://en.cnki.com.cn/Article_en/CJFDTOTAL-BMJS201707044.htm
[20] ZHU M, ZHOU J Zh, MENG X K, et al. Optimization of laser cleaning process parameters for Q345C steel rust layer based on response surface[J]. Surface Technology, 2019, 48(11): 381-391(in Chinese). http://en.cnki.com.cn/Article_en/CJFDTotal-BMJS201911044.htm
[21] WU J F, FU K, XU X X, et al. Effect of process parameters on structure of laser cladding layer[J]. Ordnance Material Science and Engineering, 2014, 37(3): 106-109(in Chinese). http://en.cnki.com.cn/Article_en/CJFDTOTAL-BCKG201403033.htm
[22] ZHANG Q M, WANG Zh D, LIU X M, et al. Influence of processing parameters on geometrical features of powder feeding laser cladding[J]. Transactions of the China Welding Institution, 2000, 21(2): 43-47(in Chinese). http://en.cnki.com.cn/Article_en/CJFDTOTAL-HJXB200002013.htm
[23] ZHANG Q M, ZHONG M L, YANG S, et al. The relationship between powder feeding laser cladding layer quality and process parameters[J]. Transactions of the China Welding Institution, 2001, 22(4): 51-54(in Chinese).
[24] TAN J H, SUN R L, NIU W, et al. Effect of laser scanning speed on microstructure and properties of TC4 alloy surface laser cladding composite coating[J]. Materials Reports, 2020, 34(12): 12094-12100(in Chinese).
[25] SUN R L, YANG D Zh, GUO L X, et al. Effect of laser parameter on microstructure and microhardness of NiCrBSi laser cladding layer[J]. Optical Technique, 2012, 27(1): 34-36(in Chinese).
-
期刊类型引用(7)
1. 龚美美,吴腾,谢林圯,师文庆,黄江,谢玉萍,乔江伟. 激光重熔对铁基/TiC复合涂层成形质量及性能研究. 应用激光. 2023(07): 1-7 .  百度学术
百度学术
2. 梁飞龙,师文庆,李凯玥,朱志凯,吴腾. Cu质量分数对激光熔覆Ni-Cu-WC涂层组织和性能的影响. 激光技术. 2023(05): 653-658 . 本站查看
3. 晁祥瑞,黄勇,陈子鹏,许学虎,李文建,王宁,张志虎. 激光重熔对In718熔覆层组织与性能的影响. 激光技术. 2023(04): 506-512 . 本站查看
4. 周妃四,李时春,陈曦,蔡文靖,欧敏,周磊. 激光增材制造工艺参数优化建模的研究进展. 激光技术. 2023(04): 469-479 . 本站查看
5. 巩江涛,舒林森,王家胜,李家豪,秦景鹏. 激光熔覆工艺优化方法研究现状及发展趋势. 激光与光电子学进展. 2023(19): 22-35 . 百度学术
6. 施晓帅,姜芙林,王玉玲,杨发展,杨勇,梁鹏,马保山. 基于响应面法的激光熔覆3540Fe涂层形貌及质量预测研究. 表面技术. 2022(12): 392-405 . 百度学术
7. 朱正兴,候早,刘秀波,刘一帆,张林,孟元,刘怀菲. 激光制备自润滑复合涂层及摩擦学性能研究进展. 中国表面工程. 2021(05): 117-130 . 百度学术
其他类型引用(4)


计量
- 文章访问数: 8
- HTML全文浏览量: 3
- PDF下载量: 7
- 被引次数: 11