Advanced Search

ISSN1001-3806 CN51-1125/TN Map

Volume 48 Issue 2
Mar.  2024
Article Contents
Turn off MathJax

Citation:

Calibration measurement and inversion of standard particle count for droplet spectrometer

  • Corresponding author: WU Bo, wubo@cuit.edu.cn
  • Received Date: 2023-01-06
    Accepted Date: 2023-03-02
  • In order to improve the measurement accuracy of droplet particle size of domestic droplet spectrometer, standard particles were used to test the scattering response of the droplet spectrum, and the least mean square algorithm was used to invert the scattering response signal of the actually measured droplet spectrum. Through theoretical analysis and experimental verification, the particle size inversion data of the least mean square algorithm under different standard particle response signals were obtained. The results show that the inversion of standard particle distribution by the least mean square algorithm can reduce the distribution error of particle size so that the particles of different sizes can be accurately distinguished. The size distinction accuracy can reach 1 μm. This study provides a reference for improving the accuracy of the droplet spectrometer.
  • 加载中
  • [1]

    PRUPPACHER H, KLETT J. Microphysics of clouds and precipitation[M]. Dordrecht, Holland: Kluwer Academic Publishers, 1997: 45-56.
    [2]

    GUNN R, PHILIPS B B. A experimental investigation of the effect of air pollution on the initiation of rain[J]. Meteorol, 1957, 14: 272-280. doi: 10.1175/1520-0469(1957)014<0272:AEIOTE>2.0.CO;2
    [3]

    STEVENS B, FEINGOLD G. Untangling aerosol effects on clouds and precipitation in a buffered system[J]. Nature, 2009, 461(7264): 607-613. doi: 10.1038/nature08281
    [4]

    BAUMGARDNER D. An analysis and comparison of five water droplet measuring instruments[J]. Journal of Applied Meteorology, 1983, 22: 891-910.
    [5]

    BAUMGARDNER D, GAYET J F, GERBER H, et al. Clouds and frog: Measurement techniques in situ[C]//Elsevier Reference Collection in Earth Systems and Environmental Sciences: Encyclopedia of Atmospheric Sciences. Amsterdam, Holland: Elsevier, 2015: 170-179.
    [6]

    MILES N L, VERLINDE J, CLOTHIAUX E E. Cloud droplet size distributions in low-level stratiform clouds[J]. Journal of the Atmospheric Sciences, 2000, 57(2): 295-311. doi: 10.1175/1520-0469(2000)057<0295:CDSDIL>2.0.CO;2
    [7]

    PINNICK R, AUVERMANN H. Response characteristics of Knollenberg light-scattering aerosol counters[J]. Journal of Aerosol Science, 1979, 10(1): 55-74. doi: 10.1016/0021-8502(79)90136-8
    [8]

    BAUMGARDNER D, BRENGUIER J L, BUCHOLTZ A. Airborne instruments to measure atmospheric aerosol particles, clouds and radiation[J]. Atmospheric Research, 2011, 102(1/2): 10-29.
    [9]

    MCFARQUHAR G M, FREER M, BAUMGARDNER D, et al. Importance of small ice crystals to cirrus properties: Observations from the tropical warm pool international cloud experiment (TWP-ICE)[J]. Geophysical Research Letters, 2007, 34(13): 13803.
    [10]

    BURKARD R, EUGSTER W, WRZESINSKY T, et al. Vertical divergence of fogwater fluxes above a spruce forest[J]. Atmospheric Research, 2002, 64(1/4): 133-145.
    [11] 赵家丰, 聂万胜, 林伟, 等. 喷雾场内液滴粒径光学测试技术进展[J]. 激光技术, 2019, 43(5): 702-707.

    ZHAO J F, NIE W Sh, LIN W, et al. Research progress of optical measurement of particle size in spray[J]. Laser Technology, 2019, 43(5): 702-707(in Chinese).
    [12]

    SPIEGEL J K, ZIEGER P, BUKOWIECKI N, et al. Evaluating the capabilities and uncertainties of droplet measurements for the fog droplet spectrometer (FM-100)[J]. Atmospheric Measurement Techniques, 2012, 5(9): 2237-2260. doi: 10.5194/amt-5-2237-2012
    [13]

    JEAN F G. Quantitative measurement of the microphysical and optical properties of cirrus clouds with four different in situ probes: Evidence of small ice crystals[J]. Geophysical Research Letters, 2002, 29(24): 1-4.
    [14]

    FUGAL J P, SHAW R A. Cloud particle size distributions measured with an airborne digital in-line holographic instrument[J]. Atmospheric Measurement Techniques, 2009, 2(2): 259-271.
    [15] 史晓丁, 冯力天, 刘英, 等. 激光云粒子成像探测仪研制[J]. 激光技术, 2023, 47(1): 67-72.

    SHI X D, FENG L T, LIU Y, et al. Laser cloud particle imaging probe[J]. Laser Technology, 2023, 47(1): 67-72.
    [16] 张艳春, 刘缠牢, 赵丁. 基于米氏散射理论的粒度测试算法研究[J]. 国外电子测量技术, 2009, 28(11): 24-25.

    ZHANG Y Ch, LIU Ch L, ZHAO D. Research of granulometric analysis algorithm based on mie scatter theory[J]. Foreign Electronic Measurement Technology, 2009, 28(11): 24-25(in Chinese).
    [17]

    HONG T. Retrieval of spherical particle size distribution with an improved tikhonov iteration method[J]. Thermal Science, 2012, 16(5): 1400-1404. doi: 10.2298/TSCI1205400T
    [18]

    ADRIAN W, DANIEL S, JOSEF G, et al. On the parametrization of optical particle counter response including instrument-induced broadening of size spectra and a self-consistent evaluation of calibration measurements[J]. Atmospheric Measurement Techniques, 2017, 10(11): 4341-4361. doi: 10.5194/amt-10-4341-2017
    [19]

    ROSENBERG P, DEAN A, WILLIAMS P, et al. Particle sizing calibration with refractive index correction for light scattering optical particle counters and impacts upon PCASP and CDP data collected during the Fennec campaign[J]. Atmospheric Measurement Techniques, 2012, 5(5): 1147-1163. doi: 10.5194/amt-5-1147-2012
    [20]

    TATSUO I, HIDETO Y. Investigation of low-angle laser light scattering patterns using the modified Twomey iterative method for particle sizing[J]. Review of Scientific Instruments, 2011, 82(1): 015111. doi: 10.1063/1.3520136
    [21] 史晓丁, 伍波, 樊冬. 基于前向Mie散射的激光雾滴谱仪[J]. 激光杂志, 2020, 41(4): 116-119.

    SHI X D, WU B, FAN D. Laser fog droplet spectrometer based on forward Mie scattering[J]. Laser Journal, 2020, 41(4): 116-119.
    [22] 张艳春. 激光粒度测试算法研究[D]. 西安: 西安工业大学, 2011: 14-66.

    ZHANG Y Ch. Study of laser granulometric analysis algorithm[D]. Xi'an: Xi'an Technological University, 2011: 14-66(in Chinese).
    [23] 刘志军, 王智超, 王君山. SMPS-3936气溶胶粒径谱仪测试原理及其性能评定[J]. 中国粉体技术, 2008, 14(2): 32-35.

    LIU Zh J, WANG Zh Ch, WANG J Sh. Discussion on principle and performance of model 3936 scan mobility paticle sizer[J]. China Powder Science and Technology, 2008, 14(2): 32-35(in Chin-ese).
  • 加载中
通讯作者: 陈斌, bchen63@163.com
  • 1. 

    沈阳化工大学材料科学与工程学院 沈阳 110142

  1. 本站搜索
  2. 百度学术搜索
  3. 万方数据库搜索
  4. CNKI搜索

Figures(9) / Tables(1)

Article views(557) PDF downloads(10) Cited by()

Proportional views

Calibration measurement and inversion of standard particle count for droplet spectrometer

    Corresponding author: WU Bo, wubo@cuit.edu.cn
  • 1. College of Optoelectronic Engineering, Chengdu University of Information Technology, Chengdu 610225, China
  • 2. Key Open Laboratory of Atmospheric Sounding, China Meteorological Administration, Chengdu 610225, China

Abstract: In order to improve the measurement accuracy of droplet particle size of domestic droplet spectrometer, standard particles were used to test the scattering response of the droplet spectrum, and the least mean square algorithm was used to invert the scattering response signal of the actually measured droplet spectrum. Through theoretical analysis and experimental verification, the particle size inversion data of the least mean square algorithm under different standard particle response signals were obtained. The results show that the inversion of standard particle distribution by the least mean square algorithm can reduce the distribution error of particle size so that the particles of different sizes can be accurately distinguished. The size distinction accuracy can reach 1 μm. This study provides a reference for improving the accuracy of the droplet spectrometer.

0.   引言
  • 云滴的尺寸谱分布是云定量微物理研究中描述云滴的关键参数之一[1]。它对云的辐射特性起着重要作用[2],云滴尺寸分布的知识对于更好地了解降水的起始状态也至关重要[3]。目前,有两种不同的测量云滴大小的方法:机载测量或在高山地面站上使用光学仪器进行现场测量[4-5],虽然现场测量相对遥测难度更大,但这种方式被认为是测量云滴的最好方法[6]。用于高山地面站测量云滴的设备通常称为雾滴谱仪,其采用的尺寸测量基本工作原理是光的前向散射。20世纪70年代建造了第1台用于现场液滴测量的商用光学仪器[7]。发展至今,基于前向散射的仪器有机载的前向散射光谱仪探头[8]、云滴探头[9]、云和气溶胶光谱仪[8]、小型冰探测器等仪器[8]、地面站使用的雾滴谱仪FM-120[10]、国产的雾滴谱仪LF-01等仪器。

    雾滴谱仪是一种基于液滴前向散射光测量原理的光学粒子计数器,测量的是单个粒子散射的光强度,因此需要将检测到的散射信号的分布转换为粒子大小的分布。准确检测粒子大小分布的关键是对雾滴谱仪响应的建模和仪器的校准,即建立仪器特定粒子散射横截面和测量信号幅度之间的关系[11]。因此,为了提高雾滴谱仪的测量准确性,本文中研究了雾滴谱仪对标准粒子的散射信号响应和算法反演。

1.   粒径校准反演原理方法
  • 光学粒子计数器探测的基本原理是:通过被光源(通常是单色激光)照明的采样区的粒子将光散射到光电探测器中[12],检测到的散射信号脉冲幅度是粒子尺寸大小的函数, 光学粒子计数器对这些脉冲进行计数,并通常根据它们的幅度将其分类到不同的尺寸通道中,因此,得到的测量数据是散射信号幅度的直方图。而从记录的散射信号振幅直方图中检索数量大小分布的数学问题具有逆性质[12],用1组第1类Fredholm积分方程描述:

    式中:Ni是尺寸通道i中的粒子数量; 相应的核函数Ki(D)给出了每个直径为D的粒子被分类到尺寸通道i中的概率; F(D)表示粒径数量分布; ΔNi为计数误差。核函数将光学粒子计数器输出的粒子计数直方图和粒子大小分布联系起来了[12]

    理想的光学粒子计数器具有绝对均匀的照明光场,仪器测量到的粒子散射信号幅度与粒子的粒径一一对应。一般情况下, 照明光束存在不均匀性, 入射光强度的不均匀性导致通过采样区的粒子在略微不同的位置的散射信号幅度存在差异。因此,即使是球形和均匀的同一尺寸粒子,其散射信号幅度大小也会有所不同,导致了信号的展宽,即光学粒子计数器输出的粒子计数直方图出现宽分布[13-15]

    光学粒子计数器校准反演的目的是弥合理论计算和仪器输出之间的差距,即找到将理论粒子散射截面与测量的散射信号幅度联系起来的仪器特定参数。校准与散射理论相结合将产生一组仪器特定参数,使人们能够预测具有给定光学特性的任何其它材料的光学粒子计数器的输出,即确定核函数[13]

    颗粒粒径的反演目前已经发展了多种反演算法[16-19],研究那些未知粒径分布函数的体系时,独立模式反演算法具有相当大的优势, 其中最小均方算法(least mean square, LMS) 具有唯一解的优势[16]。详细计算过程如下所示。

    先对粒子进行测量,得到初始列向量为 W(0),再按照下式迭代计算n次后,粒径分布于真实值处收敛:

    式中: 上标n为迭代的次数;F为光能系数矩阵,即探测到的散射信号的核函数;W为粒径分布的列向量,迭代完成后为粒子计数器输出的粒子谱分布;μ为加速收敛因子;E为光能分布的列向量,即粒子计数器按照散射信号幅度分类的粒子谱分布[16]。此种算法的优势是对于系数矩阵 F要求不高,只需F满秩就可以保证方程 FW = E具有唯一解。

2.   雾滴谱仪对标准粒子的响应
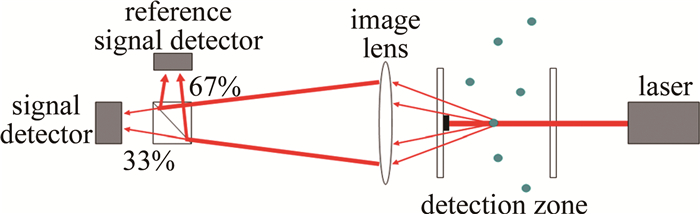
  • 本实验仪器为国产激光雾滴谱仪,型号LF-01。LF-01测量尺寸为2 μm~50 μm的液滴滴谱分布,分为32个尺寸通道输出粒子尺寸直方图。LF-01雾滴谱仪工作原理如图 1所示。

    Figure 1.  Working principle of laser droplet spectrometer

    激光雾滴谱仪是一种采用开放光路的光学粒子计数器。光源采用红光半导体激光器, 在探测区域,通过气泵抽取的颗粒穿过光束并散射激光辐射, 未散射的直射光束被遮挡并吸收[20]。在4°~12°范围内散射的光被成像镜头组传递到光分束棱镜上,其中33%和67%的光功率分别被传递到两个探测器,亦称信号探测器和参考探测器[10]。根据Mie散射理论,不同大小的粒子散射功率不同,从而探测器测得的功率大小即反映了粒子尺寸。将对应的功率分为32个等级(通道),对每个通道内的粒子进行统计,即可得到不同尺度范围内粒子的谱分布。

    仪器校准采用标准粒子,Thermo Scientific公司生产的9000系列玻璃微球有着较好均匀性,由硼硅酸盐玻璃制造,其折射率为1.51,与水的折射率存在差异,二者大小对应关系可通过查表获得。选用10 μm、20 μm、30 μm、40 μm、50 μm等5种规格的粒子[21]进行测试,尺寸分布标准偏差小于2.4 μm,对应的水滴尺寸分别为8 μm、16 μm、24 μm、32 μm、40 μm。

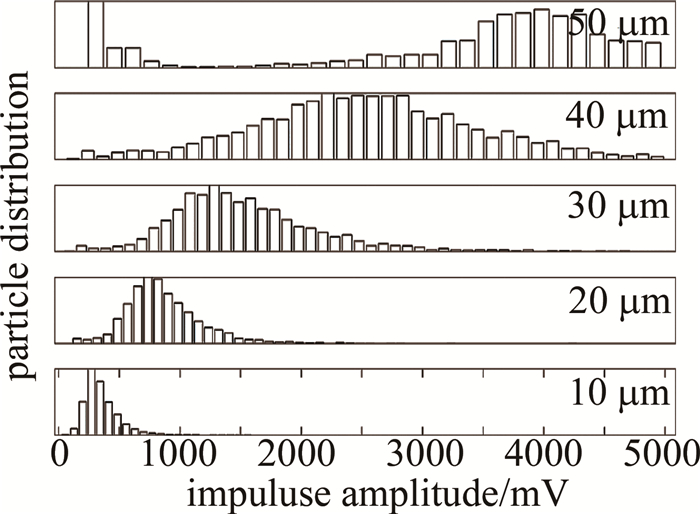
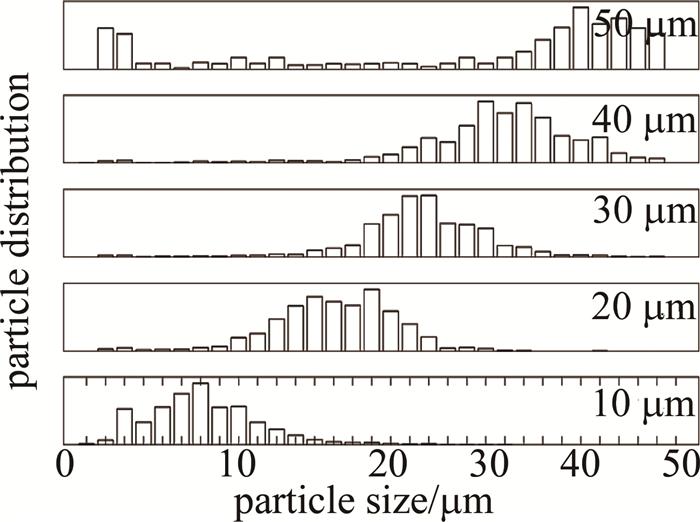
    LF-01校准测量的标准粒子散射信号响应分布如图 2所示。图中的横坐标为数值化后的粒子散射信号脉冲幅度,所示数值均为使用标准粒子多次测量后的平均值。对应的雾滴谱仪输出的粒子计数直方图如图 3所示。

    Figure 2.  Response distribution of standard particle scattered signal

    Figure 3.  Standard particle count histogram of droplet spectrometer output

3.   雾滴谱仪测量结果的校准反演
  • 粒径的校准反演的第1步是构造光能系数矩阵。雾滴谱仪测量范围是2 μm~50 μm,输出32通道粒子计数直方图,相应的光能系数矩阵为32×32元矩阵,矩阵的每一列为仪器测量相应尺寸粒子获得的概率密度分布。理论上光能系数矩阵需要用与仪器尺寸通道一一对应的标准粒子进行测试后才能完整地构造,但是实际中能够获得标准尺寸粒子是有限的,因此用前文中的5种标准尺寸粒子进行测试,将得到的对应列向量的相邻列依次填充,构成光能系数矩阵。

    实验测得对应8 μm、16 μm、24 μm、32 μm、40 μm水滴粒子的概率密度分布如图 4所示。由于测试的样本数有限,难以避免如图中所示图形不平滑的情形,因此图中对矩阵列向量做了顺化处理。由于在大样本和高精度条件下,光散射随机信号群的幅度、宽度、信号子集以及不同性质特征量的统计分布均能很稳定地服从以自然数为自变量的对数正态分布。因此雾滴谱仪测量的粒子分布假设为对数正态分布,对光能系数矩阵中无相应标准粒子进行测试的列向量,可由相邻已知列向量结合对数正态分布规律进行拟合填充,填充结果如图 5所示。

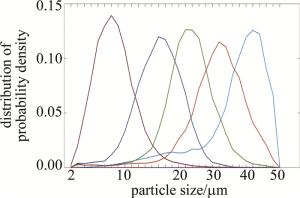
    Figure 4.  Probability density distribution of standard particles

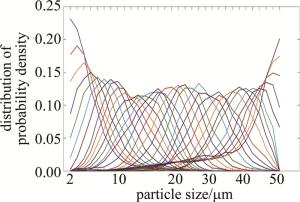
    Figure 5.  32 columns of the completed light energy coefficient matrix

    在构造完成光能系数矩阵后,就可以采用最小均方算法对雾滴谱仪每次测量后的粒子分布直方图进行反演,得到馈入雾滴谱仪的真实粒子分布。反演时,首先根据雾滴谱仪测量的粒子分布谱计算概念密度分布,赋为W (即粒径分布列向量)的初始值,迭代收敛因子[22]取为1。

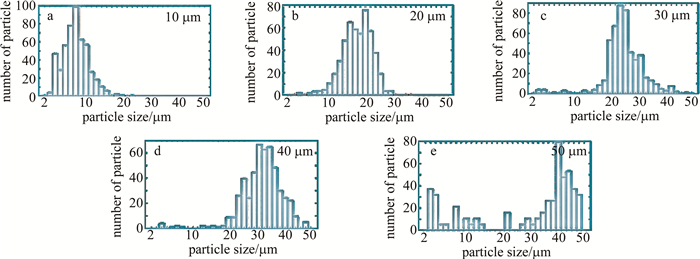
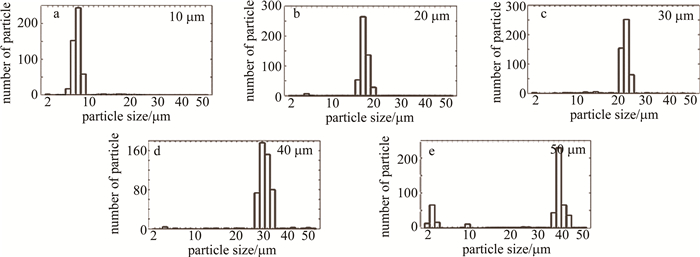
    分别采用10 μm、20 μm、30 μm、40 μm、50 μm等5种规格的进口硼硅酸盐标准玻璃微球进行了测量和反演,结果如图 6图 7所示。图 6分别为雾滴谱仪单次测量10 μm、20 μm、30 μm、40 μm、50 μm标准粒子后输出的粒子分布直方图,图 7分别为LMS算法反演后的结果。

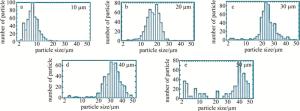
    Figure 6.  Measurement results of standard particle

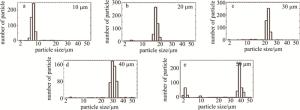
    Figure 7.  Inversion results of standard particle

    图 7可知,经LMS算法的反演后,可准确测量5种标准粒子的尺寸,对应单一通道粒子数量占比超过40%,反演后测量效果得到有效提升。为了更好地评价粒径反演算法反演结果的优劣,按照标准的粒径谱仪校准规范[23],定义粒径分布误差ε如下:

    式中: D为雾滴谱仪3次测量结果的平均值; Ds为标准粒子的粒径标准值。分布误差越小,说明粒度测量的精度越高。以直方图分布重心为测量值,分别取3组测量数据的原始测量平均值$ \overline{D_0}$,以及经过LMS反演后的测量平均值$ \overline{D_i}$,分别进行原始分布误差ε0和反演后分布误差εi的计算,结果如表 1所示。

    glass size/μm Ds/μm D0/μm Di/μm ε0/% εi/%
    10 8 7.87 8.02 5.50 0.36
    20 16 16.48 16.07 3.06 0.45
    30 24 25.55 23.86 6.47 0.85
    40 32 30.84 31.79 3.60 0.62

    Table 1.  Distribution errors of standard parficle of original measurement data and after LMS algorithm inversion

    可见,原始测量数据存在较大分布误差,经过LMS算法反演后的分布误差有效降低,可以准确区分每个测量尺寸通道的粒子,粒径测量准确率得到有效提高,尺寸区分精度可以达到1 μm。因实验标准粒子产品有限,无法对每个通道、每个尺寸的标准粒子进行一一测量实验,但LMS算法反演后的分布误差极低,若雾滴谱仪的每个测量通道均有相应的标准粒子进行测试,实测效果预计可以接近仿真结果。

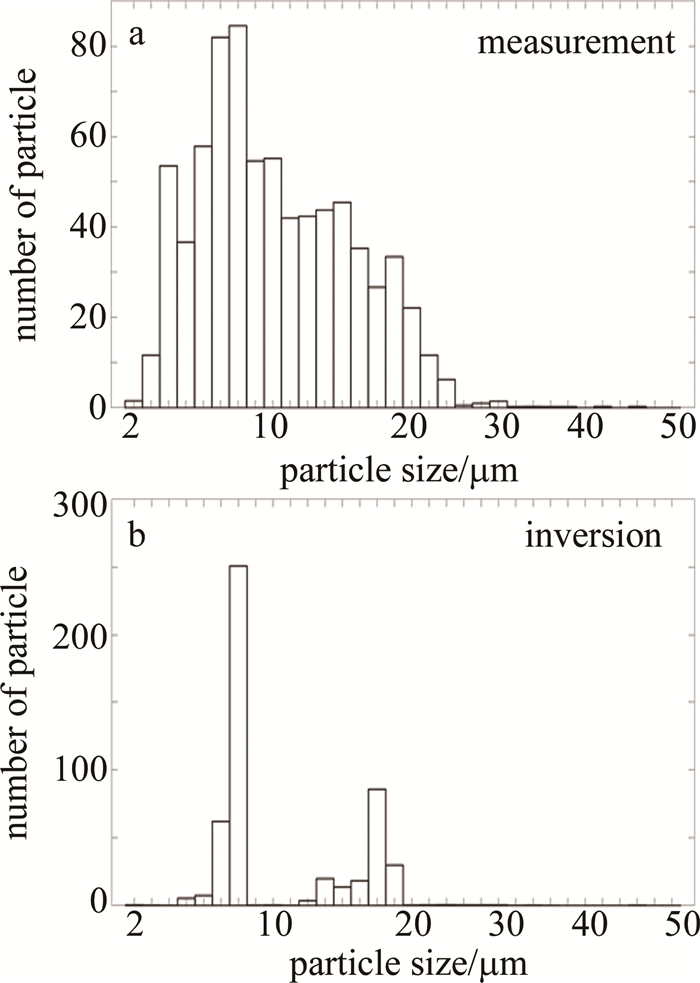
    此外,雾滴谱仪的使用场景通常伴随复杂的粒子环境,因此设计将标准粒子混合来模拟复杂粒子环境,以此检验LMS算法的反演效果。多种标准粒子混合后的测量和反演结果如图 8图 9所示。图 8为10 μm和20 μm标准粒子按照3 ∶1的比例混合后测量结果和反演结果,图 8a为测量输出,图 8b为反演结果。图 9为10 μm、20 μm和40 μm 3种标准粒子按照3 ∶1 ∶1的比例混合后测量结果和反演结果,图 9a为测量输出,图 9b为反演结果。由图 8图 9可知,LMS算法对粒径分布进行反演有效减小了粒子分布宽度,反演后可明显地将各种粒子区分开。对直方图按照标准粒子比例对通道进行3段分段并计算分布重心,测得3种粒子的分布误差较低,且计数的粒子比例符合测量样本比例,说明LMS算法对于粒径的反演有效减小粒子分布宽度,提升粒径测量分辨率。

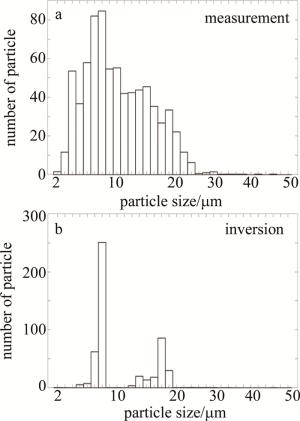
    Figure 8.  Measurement results and inversion results after mixing of 10 μm and 20 μm standard particles

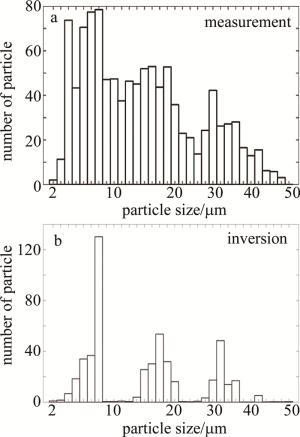
    Figure 9.  Measurement and inversion results after mixing of 10 μm, 20 μm and 40 μm standard particles

4.   结论
  • 从光学粒子计数器输出的直方图数据中反演出准确的气溶胶粒子大小分布是一项具有挑战性的工作。为了提高国产雾滴谱仪的雾滴粒子粒径测量准确性,采用标准粒子进行雾滴谱的散射响应测试,并采用最小均方算法对于实际测量的雾滴谱的散射响应信号进行了反演。结果表明,LMS算法对标准粒子分布的反演能够减小粒径的分布误差,使得不同尺寸的粒子得到准确区分,尺寸区分精度可以达到1 μm。该研究为雾滴谱仪的精度提升提供了参考。

Reference (23)

Catalog

    /

    DownLoad:  Full-Size Img  PowerPoint
    Return
    Return