Advanced Search

ISSN1001-3806 CN51-1125/TN Map

Volume 45 Issue 1
Jan.  2021
Article Contents
Turn off MathJax

Citation:

Measurement and analysis of absolute spectral response efficiency of photoelectric imaging system

  • Corresponding author: ZENG Yan'an, zya401@hust.edu.cn
  • Received Date: 2019-12-30
    Accepted Date: 2020-01-22
  • In order to accurately measure the absolute spectral response efficiency of the photoelectric imaging system, the optical energy transfer formula of the optical system and the physical model of the image sensor were analyzed, and the calculation formula of the absolute spectral response efficiency of the photoelectric imaging system was obtained. Based on the theoretical formula, an absolute spectral response efficiency measurement device for the photoelectric imaging system based on integrating spheres, multispectral light source of light-emitting diode, standard detector, and a transmission-type parallel light tube was designed. Experimental measurement and analysis of visible light digital cameras with known spectral response efficiency was carried out. The results show that, the absolute spectral response efficiency of the visible light digital camera measured by the measuring device in the wavelength range of 380nm~1100nm is in good agreement with the standard value, and the maximum relative error is 1.7%. When the probability is 95%, it is less than 0.2%, which meets the general measurement requirements. The device can accurately measure the absolute spectral effect efficiency of the photoelectric imaging system.
  • 加载中
  • [1]

    JIANG W J, ZENG X W, SHI J H. Optical technology[M]. Beijing: Science Press, 2009: 184-228(in Chinese).
    [2]

    SUN H H, LIU Y Y. Application and test of two different high-speed digital CMOS image sensors[J]. Chinese Optics, 2011, 4(5):453-460(in Chinese).
    [3]

    ZHANG X H, HAN Ch Y, PAN Y L, et al. Evaluation of general image quality of transfer optical remote sensing CCD camera[J]. Infrared and Laser Engineering, 2008, 37(4):697-701(in Chinese).
    [4]

    SHAO X P, WANG Y, GAO P, et al. Measurement method and setup of the quantum efficiency for charge coupled devices[J]. Infrared and Laser Engineering, 2013, 42(s1):103-106(in Chinese).
    [5]

    WANG J S, HUI F, AN Zh Y. Research on the spectrum transmissi-vity detection system of the optical sight[J]. Science Technology and Engineering, 2010, 10(33):8259-8261(in Chinese).
    [6]

    LI Zh. Test system of spectral transmission based on the correlation and amplification principle[D].Changchun: Changchun University of Science and Technology, 2010: 5-11(in Chinese).
    [7]

    FANG Zh L. Performance test of portable imaging spectrometer[D].Wuhan: Huazhong University of Science and Technology, 2016: 6-11(in Chinese).
    [8]

    ZHOU Y J, ZHAO B Q, WANG P. Study on a measurement method of CCD imaging luminance meter[J]. Electronics Optics & Control, 2010, 17(12):49-52(in Chinese).
    [9]

    WANG L E, ZHANG Sh Q. The Evaluating method of the measurement error of photoelectric imaged luminance meters[J]. China Light & Lighting, 2001(1):20-21(in Chinese).
    [10]

    ZHANG Y M. Applied optics[M].4th ed.Beijing: Publishing House of Electronics Industry, 2015: 359-362(in Chinese).
    [11]

    EUROPEAN MACHINE VISION ASSOCIATION. EMVA standard 1288, standard for characterization of image sensors and cameras release 3.1[S]. Barcelona, Spain: European Machine Vision Association, 2010: 4-6.
    [12]

    PENG X M. The research of CMOS image sensor testing system based on EMVA standard 1288[D]. Harbin: Harbin Engineering University, 2015: 9-12(in Chinese).
    [13]

    YANF H, KANG D K, JIANG Ch L, et al. Calibration for integra-ted parameters of visible photoelectric imaging system[J]. Journal of Applied Optics, 2015, 36(2):253-258(in Chinese).
    [14]

    LI W J, ZHANG Y, YU Y, et al. Measurement and experiment study on imaging performance of visible imaging system[J].Journal of Optoelectronics·Laser, 2013, 24(12):2360-2366(in Chin-ese).
    [15]

    YING M Y. Evaluation of image quality of electro-optical imaging system [D]. Changchun: Changchun Institure of Optics, Fine Mechanics and Physics, Chinese Academy of Sciences, 2010: 49-52(in Chinese).
    [16]

    JIN W Q, GAO Sh Sh, WANG J H, et al. A model to predict range performance of imaging system for extended target based on mininum resolvable contrast [J]. Acta Optica Sinica, 2009, 29(6):1552-1556(in Chinese). doi: 10.3788/AOS20092906.1552
    [17]

    SHANG Y Y, ZHANG W G, SONG Y, et al. Research on evaluation method of CMOS imager[J]. Laser & Optoelectronics Progress, 2010, 47(5):69-74(in Chinese).
    [18]

    ZENG Y, ZENG Y A, ZHNAG N Y Sh, et al. A novel method to improve spectral detection capability of imaging spectrometers [J]. Laser Technology, 2018, 42(2):196-200(in Chinese).
    [19]

    HE Y W, LI P, WU H P, et al. Output irradiance uniformity of integrating sphere source [J]. Journal of Applied Optics, 2012, 33(3):548-553(in Chinese).
    [20]

    YUAN Y L, ZHENG X B, WU H Y, et al. Uniformity research of integrating spheres reference light source with large exit aperture[J]. Acta Photonica Sinica, 2015, 44(4):0422003(in Chinese). doi: 10.3788/gzxb20154404.0422003
    [21]

    WEN Zh P, MA Zh Y, WEI H Y, et al. Optimized design of combined spectrum LED light source for plant growth[J]. China Illuminating Engineering Journal, 2018, 29(4):39-44(in Chinese).
  • 加载中
通讯作者: 陈斌, bchen63@163.com
  • 1. 

    沈阳化工大学材料科学与工程学院 沈阳 110142

  1. 本站搜索
  2. 百度学术搜索
  3. 万方数据库搜索
  4. CNKI搜索

Figures(5) / Tables(3)

Article views(7587) PDF downloads(22) Cited by()

Proportional views

Measurement and analysis of absolute spectral response efficiency of photoelectric imaging system

    Corresponding author: ZENG Yan'an, zya401@hust.edu.cn
  • Department of Optoelectronic Engineering, School of Optical and Electronic Information, Huazhong University of Science and Technology, Wuhan 430074, China

Abstract: In order to accurately measure the absolute spectral response efficiency of the photoelectric imaging system, the optical energy transfer formula of the optical system and the physical model of the image sensor were analyzed, and the calculation formula of the absolute spectral response efficiency of the photoelectric imaging system was obtained. Based on the theoretical formula, an absolute spectral response efficiency measurement device for the photoelectric imaging system based on integrating spheres, multispectral light source of light-emitting diode, standard detector, and a transmission-type parallel light tube was designed. Experimental measurement and analysis of visible light digital cameras with known spectral response efficiency was carried out. The results show that, the absolute spectral response efficiency of the visible light digital camera measured by the measuring device in the wavelength range of 380nm~1100nm is in good agreement with the standard value, and the maximum relative error is 1.7%. When the probability is 95%, it is less than 0.2%, which meets the general measurement requirements. The device can accurately measure the absolute spectral effect efficiency of the photoelectric imaging system.

引言
  • 光电成像系统目前广泛应用于工业检测、航空航天、天文观测、医学、安防等领域,随着应用的不断深入,建立完善的光电成像系统的性能测量系统以及评价标准意义重大。光谱响应效率是光电成像系统的一项重要指标,直接影响被测目标的光度学和色度学特性[1]

    目前, 国内外光电成像系统光谱响应的测量大多采取分步进行的方式,即独立测量成像传感器的量子效率以及光学镜头的光谱透过率,再通过理论分析的方式给出系统的光谱响应效率[2-6]。而对光电成像系统光谱响应效率的直接测量研究较少,在国内尤为如此。因此,本文中基于对现有的光学成像系统中光能量传递模型和图像传感器物理模型的分析,得到了光电成像系统光能量-灰度值传递模型公式,并从中分析出了光电成像系统绝对光谱响应效率的计算公式。根据此公式设计了基于积分球、多光谱发光二极管(light-emitting diode, LED)、标准探测器和同轴透射式平行光管的光电成像系统的绝对光谱响应效率测量装置。通过对绝对光谱响应效率已知的可见光数字相机进行测量,结果证明了测量方法的正确性。

1.   系统光谱响应效率测量原理
  • 对于光电成像系统绝对光谱响应效率的测量,就是给出系统不同光谱能量转换效率的曲线[7],因此需要建立外界光能量至光电成像系统输出灰度值的物理模型。

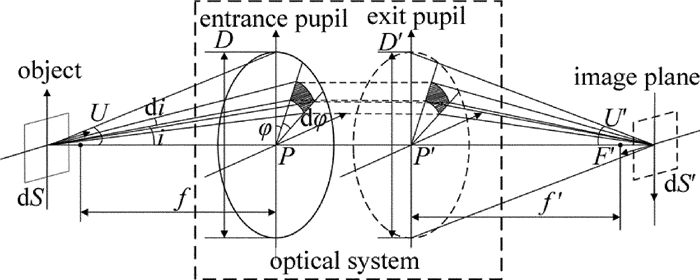
  • 光学成像系统光能量传递模型,讨论的是光能量从光学成像系统的始端(物面)到终端(像面)的传递过程,传递示意图如图 1所示。

    Figure 1.  Optical imaging system energy transfer

    根据现有摄影光学成像系统中心视场能量传递的研究[8-10],当图 1中物面为余弦辐射面时,像面处接收到的辐射照度E(λ)为:

    式中,λ为波长,K(λ)为光学系统的光谱透过率,L(λ)为物面的辐射亮度,D是系统通光口径,f为焦距,βzβ分别为系统出瞳平面和像平面位置上的垂轴放大率。

    (1) 式即为光学成像系统光能量传递公式,当给定探测物面的辐射亮度L(λ)和光学镜头的标准参量后,即可得到图像传感器表面中心辐射照度E(λ)。

    在光电成像系统中,光学镜头的焦距f与通光口径D的比值用光圈数F表征,且一般采用对称结构设计,则βz=1[10]。为方便测量,一般使成像系统对无穷远成像,则有:

  • 目前可见光近红外成像系统多以互补金属氧化物半导体(complementary metal oxide semiconductor, CMOS)或电荷耦合器件(charge coupled device, CCD)图像传感器作为成像器件,两者均主要由像敏阵列和集成电路组成,具有相同的物理模型,但具体实现机制不同。图像传感器可将一段曝光时间内像敏阵列接收到的光信号转换成电信号,并经过相应的信号处理电路将其转换成数字信号输出[11-12]图 2为图像传感器的物理模型示意图。

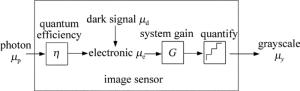
    Figure 2.  Physical model of the image sensor

    图 2所示,在一定曝光时间内,平均μp个光子经过图像传感器产生μe个电子,其转换效率即图像传感器的量子效率η(λ), 为两者的比值,可表示为:

    转换之后的电子被转换成电压,经过放大、A/D转换后,以数字灰度值的形式输出。根据模型分析,可得图像传感器输出灰度值与入射到图像传感器的光信号之间的关系为:

    式中,μy为图像传感器像素输出的灰度值; μy,dark是无光照条件下输出的暗信号,仅取决于曝光时间和温度; G为传感器的系统总增益,可通过光子转移法测得; λ为波长; A为图像传感器的像元面积; h为普朗克常数; c为光速; texp为传感器的曝光时间。

  • 结合上述理论和公式,可推导得光电成像系统对无穷远处成像时的光能量-灰度值传递公式:

    (5) 式是光电成像系统对无穷远目标成像的基本模型公式,表征了从无穷远处的物方至图像传感器像素输出灰度值的能量传递过程。其中,镜头的光谱透过系数K(λ)与图像传感器量子效率η(λ)的乘积即为可见光成像系统绝对光谱响应效率R(λ),则有:

2.   测量装置设计
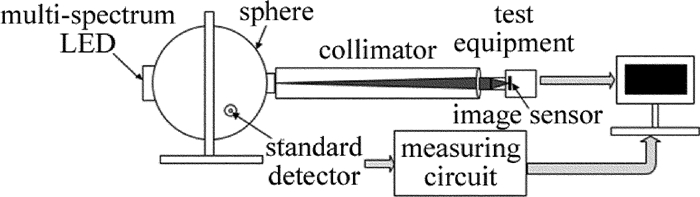
  • 根据光电成像系统绝对光谱响应测量原理,设计了由积分球、多光谱LED光源、标准探测器和同轴透射式平行光管共同构成的测量装置[13-18],装置的总体示意图如图 3所示。

    Figure 3.  Test system diagram

    图 3中,使用积分球和多光谱LED共同构成光源模块。积分球输出近似为朗伯辐射体,既可以保证测量系统光源的面均匀性,又能满足模型中物面为余弦辐射面的理论前提[19-20]。积分球直径为300mm,出口直径为40mm,出光口面均匀性高于96%。积分球的光源为多个单色LED构成光谱范围380nm~1100nm的多光谱光源,光谱范围基本涵盖常用可见光图像传感器的光谱响应范围,满足测量需求[21]

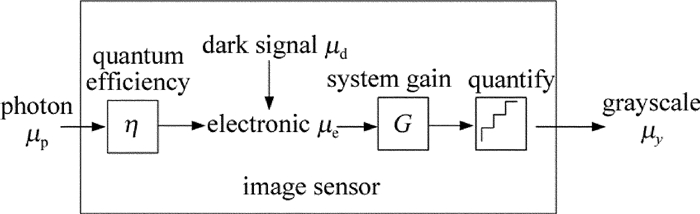
    为准确测量积分球光源在不同波长LED工作时的辐射亮度L(λ),选择光谱灵敏度已知的标准探测器FDS100。图 4a为FDS100标准探测器的光谱灵敏度曲线, 图 4b为FDS100工作测量电路。通过测量探测器测量电路中采样电阻Rl两端的电压Vr,可以准确计算当前积分球光源的辐射亮度L(λ):

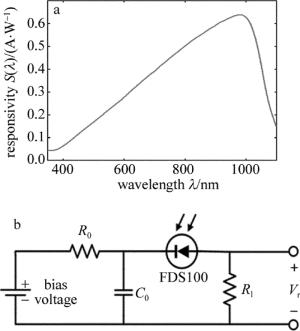
    Figure 4.  FDS100 standard detector

    式中,Ad为标准探测器有效探测面积,S(λ)为标准探测器光谱灵敏度。

    结合(6)式与(7)式,可得设计测量系统中被测设备绝对光谱响应效率计算公式:

    为满足被测光电成像系统对积分球的出光口表面为无穷远成像的要求,使用同轴透射式平行光管对输出光进行准直,将积分球出光口放置在同轴透射式平行光管焦点处。使用的平行光管的焦距为550mm,出光口径为50mm,对可见光波段透过率接近于1。

    测量时将被测光电成像系统放置在平行光管的出光口后,调焦至对无穷远成像。通过测量被测设备对不同光谱光源目标的输出灰度值,结合标准探测器输出结果和被测成像系统已知参量,代入(8)式中即可得到被测光电成像系统的绝对光谱响应效率。

3.   实验结果与分析
  • 使用研制的测量装置,对某款性能参量已知的可见光CMOS数字相机进行绝对光谱响应效率测量,并对结果进行分析。表 1中为该可见光数字相机CMOS图像传感器参量,表 2中为成像镜头参量。

    parameter value
    optical format (1/2.5)″(4:3)
    active imager size 5.70mm×4.28mm
    active pixels 2592×1944
    pixel size 2.2μm × 2.2μm

    Table 1.  Image sensor parameters

    parameter value
    focal length 75mm
    maximum aperture ratio 1:2.8
    operation range 0.3m~∞

    Table 2.  Image lens parameters

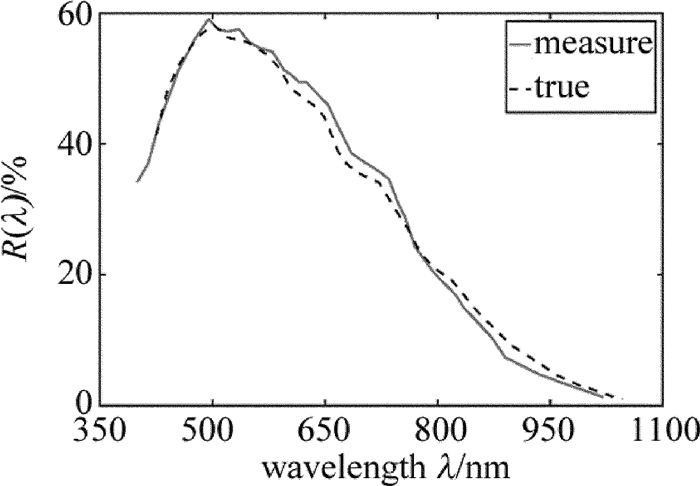
    在暗室环境下,设置被测可见光数字相机曝光时间为10ms,利用所研制的测量装置测量被测设备在不同波长光源情况下的灰度值和标准探测器的输出值,计算得到被测设备的绝对光谱响应效率R(λ)。表 3中为被测可见光数字相机的绝对光谱响应效率测量结果。其中绝对光谱响应效率测量值为各个波长测量点测量5次的平均值,并给出了各波长测量点在置信概率为95%时的A类不确定度μA(λ)。为验证测量结果的准确性,将测量结果与被测设备光谱响应效率标准值进行比较,并将曲线共同绘于图 5中。

    wavelength λ/nm R (λ)/% μA(λ)/%
    380 29.52 0.141
    400 34.14 0.156
    415 37.14 0.132
    429 43.22 0.145
    455 51.27 0.167
    477 56.08 0.185
    495 59.09 0.145
    508 57.53 0.132
    521 57.17 0.117
    535 57.56 0.174
    550 55.52 0.192
    565 54.59 0.132
    580 54.12 0.147
    596 51.24 0.127
    605 50.61 0.134
    615 49.50 0.148
    625 49.51 0.120
    643 47.29 0.166
    654 46.02 0.188
    669 42.37 0.173
    685 38.67 0.160
    697 37.64 0.183
    719 36.06 0.155
    735 34.68 0.159
    748 30.82 0.179
    756 29.05 0.183
    770 24.30 0.191
    795 20.36 0.143
    825 16.83 0.156
    835 15.00 0.142
    848 13.45 0.185
    873 10.32 0.123
    890 7.42 0.133
    935 4.83 0.137
    963 3.64 0.146
    1021 1.33 0.163

    Table 3.  Spectral response efficiency measurement results

    Figure 5.  Measurement result curve

    表 3中数据及图 5中曲线可以看出:各个波长测量点在多次测量时,其A类不确定度在置信概率95%时均小于0.2%,测量平均值与标准值之间的最大相对误差为1.7%,表明测量装置具有较好的稳定性,测得的可见光数字相机的绝对光谱响应效率与标准值一致性较好。

4.   结论
  • 在分析光学成像系统光能量传递模型和图像传感器物理模型的基础上,得到了光电成像系统光能量-灰度值传递公式以及绝对光谱响应效率的计算公式。并设计了基于积分球、多光谱LED光源、标准探测器和同轴透射式平行光管的可见光成像系统绝对光谱响应效率测量装置。利用此装置对性能参量已知的可见光数字相机进行了测量和分析。结果表明,测量装置测得的可见光数字相机的绝对光谱响应效率与标准值具有较好的一致性,最大相对误差为1.7%,各波长点的测量不确定度在置信概率为95%时均小于0.2%,能够准确对光电成像系统的绝对光谱效应效率进行测量。

Reference (21)

Catalog

    /

    DownLoad:  Full-Size Img  PowerPoint
    Return
    Return