Advanced Search

ISSN1001-3806 CN51-1125/TN Map

Volume 48 Issue 4
Jul.  2024
Article Contents
Turn off MathJax

Citation:

Study of OCT weld depth curve fitting method for laser keyhole welding

  • Corresponding author: GAO Xiangdong, gaoxd@gdut.edu.cn
  • Received Date: 2023-07-04
    Accepted Date: 2023-08-28
  • In order to solve the online detection of laser welding depth of fusion and to solve the problem of optical coherence tomography (OCT) depth of fusion detection signal noise, a percentile filtering plus moving average algorithm was used to fit the weld depth curve. The weld depth of 304 stainless steel keyhole welding process was detected online by optical coherence photomicrographic imaging system, in the process of extracting the percentile depth curves from the original scatter data using percentile filtering; it was found that there were spikes interfering noises in the percentile depth melting curves extracted by this method, and the percentile depth curves were processed by low-pass filtering through the moving average algorithm, and the OCT weld depth curves were finally extracted and fitted from the original scatter data. The results show that, comparing the OCT weld depth curve with the actual weld depth curve on the longitudinal surface of the weld, the measurement accuracy of the OCT depth of fusion curve obtained by this method has been improved by 15% at most. The method is effective in extracting and fitting more accurate OCT weld depth curves from the original scatter data.
  • 加载中
  • [1]

    XIAO X, LIU X, CHENG M, et al. Towards monitoring laser welding process via a coaxial pyrometer[J]. Journal of Materials Processing Technology, 2020, 277: 116409. doi: 10.1016/j.jmatprotec.2019.116409
    [2]

    SANDERS P G, LEONG K H, KESKE J S, et al. Real-time monitoring of laser beam welding using infrared weld emissions[J]. Journal of Laser Applications, Laser Institute of America, 1998, 10(5): 205-211. doi: 10.2351/1.521853
    [3]

    WANG L, MOHAMMADPOUR M, GAO X, et al. Adjustable ring mode (ARM) laser welding of stainless steels[J]. Optics and Lasers in Engineering, 2021, 137: 106360. doi: 10.1016/j.optlaseng.2020.106360
    [4] 李竹曼, 高向东, 张南峰. 大功率碟片激光焊接状态多特征融合分析法[J]. 激光技术, 2017, 41(5): 764-768.

    LI Zh M, GAO X D, ZHANG N F. Analysis of high-power disk laser welding status based on multi-feature fusion[J]. Laser Technology, 2017, 41(5): 764-768(in Chinese).
    [5]

    FAN X, GAO X, LIU G, et al. Research and prospect of welding monitoring technology based on machine vision[J]. The International Journal of Advanced Manufacturing Technology, 2021, 115(11/12): 3365-3391.
    [6]

    ZHANG X, TANG Z, WU Y, et al. Progress in in situ X-ray imaging of welding process[J]. Review of Scientific Instruments, Melville: AIP Publishing, 2022, 93(7): 071501. doi: 10.1063/5.0074042
    [7]

    HUANG D, SWANSON E A, LIN C P, et al. Optical coherence tomography[J]. Science, 1991, 254(5035): 1178-1181. doi: 10.1126/science.1957169
    [8]

    DUPRIEZ N D, DENKL A. Advances of OCT technology for laser beam processing: Precision and quality during laser welding[J]. Laser Technik Journal, 2017, 14(4): 34-38. doi: 10.1002/latj.201700021
    [9] 刘逸飞, 苏亚, 姚晓天, 等. OCT无创血糖检测图像处理最优化方法研究[J]. 激光技术, 2023, 47(2): 178-184.

    LIU Y F, SU Y, YAO X T, et al. An optimization method of image processing for OCT non-invasive blood glucose detection[J]. Laser Technology, 2023, 47(2): 178-184(in Chinese).
    [10]

    MIYAGI M, KAWAHITO Y, KAWAKAMI H, et al. Dynamics of solid-liquid interface and porosity formation determined through X-ray phase-contrast in laser welding of pure Al[J]. Journal of Materials Processing Technology, 2017, 250: 9-15. doi: 10.1016/j.jmatprotec.2017.06.033
    [11]

    LOHAUS L, BAUTZE T, DIEPOLD K. Evaluation of optical sensors for laser welding in a technical cognitive environment[C]//International Congress on Applications of Lasers & Electro-Optics. Anaheim, California, USA: Laser Institute of America, 2010: 1541-1546.
    [12]

    BLECHER J J, GALBRAITH C M, van VLACK C, et al. Real time monitoring of laser beam welding keyhole depth by laser interferometry[J]. Science and Technology of Welding and Joining, 2014, 19(7): 560-564. doi: 10.1179/1362171814Y.0000000225
    [13]

    DORSCH F, HARRER T, HAUG P, et al. Process control using capillary depth measurement[C]// International Congress on Applications of Lasers & Electro-Optics. San Diego, California, USA: Laser Institute of America Press, 2016: 1505.
    [14] 谢冠明, 王三宏, 张跃强, 等. 基于光学相干层析的激光焊接熔深检测方法[J]. 光学学报, 2023, 43(11): 1114002.

    XIE G M, WANG S H, ZHANG Y Q, et al. Laser welding depth monitoring method based on optical coherence tomography[J]. Acta Optica Sinica, 2023, 43(11): 1114002(in Chinese).
    [15] 黄威威, 游德勇, 高向东, 等. 基于相关分析和神经网络的激光焊接稳态识别[J]. 激光技术, 2022, 46(3): 312-319.

    HUANG W W, YOU D Y, GAO X D, et al. Laser welding steady status recognition method based on correlation analysis and neural network[J]. Laser Technology, 2022, 46(3): 312-319(in Chinese).
    [16]

    SOKOLOV M, FRANCIOSA P, SUN T, et al. Applying optical coherence tomography for weld depth monitoring in remote laser welding of automotive battery tab connectors[J]. Journal of Laser Applications, Laser Institute of America, 2021, 33(1): 012028.
    [17]

    DUIN R, HARINGA H, ZEELEN R. Fast percentile filtering[J]. Pattern Recognition Letters, 1986, 4(4): 269-272.
    [18]

    BOLEY M, FETZER F, WEBER R, et al. Statistical evaluation method to determine the laser welding depth by optical coherence tomography[J]. Optics and Lasers in Engineering, 2019, 119: 56-64.
    [19]

    MITTELSTÁDT C, MATTULAT T, SEEFELD T, et al. Novel approach for weld depth determination using optical coherence tomography measurement in laser deep penetration welding of aluminum and steel[J]. Journal of Laser Applications, 2019, 31(2): 022007.
    [20]

    SCHMOELLER M, STADTER C, LIEBL S, et al. Inline weld depth measurement for high brilliance laser beam sources using optical coherence tomography[J]. Journal of Laser Applications, Laser Institute of America, 2019, 31(2): 022409.
  • 加载中
通讯作者: 陈斌, bchen63@163.com
  • 1. 

    沈阳化工大学材料科学与工程学院 沈阳 110142

  1. 本站搜索
  2. 百度学术搜索
  3. 万方数据库搜索
  4. CNKI搜索

Figures(11) / Tables(1)

Article views(1057) PDF downloads(10) Cited by()

Proportional views

Study of OCT weld depth curve fitting method for laser keyhole welding

    Corresponding author: GAO Xiangdong, gaoxd@gdut.edu.cn
  • Guangdong Provincial Welding Engineering Technology Research Center, School of Electromechanical Engineering, Guangdong University of Technology, Guangzhou 510006, China

Abstract: In order to solve the online detection of laser welding depth of fusion and to solve the problem of optical coherence tomography (OCT) depth of fusion detection signal noise, a percentile filtering plus moving average algorithm was used to fit the weld depth curve. The weld depth of 304 stainless steel keyhole welding process was detected online by optical coherence photomicrographic imaging system, in the process of extracting the percentile depth curves from the original scatter data using percentile filtering; it was found that there were spikes interfering noises in the percentile depth melting curves extracted by this method, and the percentile depth curves were processed by low-pass filtering through the moving average algorithm, and the OCT weld depth curves were finally extracted and fitted from the original scatter data. The results show that, comparing the OCT weld depth curve with the actual weld depth curve on the longitudinal surface of the weld, the measurement accuracy of the OCT depth of fusion curve obtained by this method has been improved by 15% at most. The method is effective in extracting and fitting more accurate OCT weld depth curves from the original scatter data.

0.   引言
  • 激光焊接是一种以高能量密度激光束作为热源的焊接方法。在工程实际焊接过程中,由于各种不可控的因素,焊接件容易出现各种缺陷(如热裂纹、气孔、驼峰等),其中对焊缝质量影响最严重的缺陷之一就是焊缝深度不足。对于激光焊接的熔深检测,研究人员已经提出了如高温计、光电二极管、光谱仪、光学相机和X射线成像等检测系统。高温计、光电二极管、光谱仪等检测系统主要通过检测激光焊接过程中的辐射光强来间接反映焊接过程的熔深信息[1-4]。光学相机可以对激光焊接过程进行持续拍摄,再通过相应的图像处理方法获得熔池深度[5]。由于这些系统检测对象都是激光焊接过程的中间量,所以易受焊接过程的干扰信号影响,在连续焊接过程中,难以获得较高的熔深检测精度。在激光焊接过程的监控中,原位X射线成像技术是通过材料的侧视图检查匙孔行为的有效方法,其可以实时观察激光制造过程中液态金属的动态流动和匙孔的演变,在熔深检测上亦有很好的效果[6]。由于X射线成像技术是基于X射线和γ射线穿过对普通光不透明的金属等材料并产生透射辐射能量的摄影记录能力,所以,X射线的潜在辐射危害限制了它们的使用。因此,探索出一套用于工业自动化环境和能直接测量熔深的检测系统对激光焊接工艺自动化具有重要意义。

    光学相干光层析成像(optical coherence tomography,OCT)技术具有非接触式部署、高动态范围、微米分辨率和无损检测等优点,是目前工业激光过程检测成熟技术的极限[7-9]。激光焊接通常分为热传导焊和匙孔焊两种焊接模式,OCT熔深检测系统实质上是对匙孔深度的测量,因此,其只针对于激光匙孔焊模式下的熔深检测。MIYAGI等人[10]在对匙孔进行原位X射线成像的研究中发现,匙孔深度仅比焊缝熔深小9 μm,可以用匙孔深度近似度量激光焊接的焊缝深度。基于上述特点,OCT为激光焊接过程中的熔深在线检测提供了一种有效的方案。2010年,LOHAUS等人[11]将基于激光三角测量的光学传感器与基于光学相干断层扫描的光学传感器进行了比较,验证了OCT技术在激光材料加工中的适用性。BLECHER等人[12]利用OCT技术对激光焊接焊缝深度进行在线检测,将OCT传感器获取的焊缝深度数据与焊缝的金相截面进行比较,结果显示,两者之间具有良好的对应关系。DORSCH等人[13]利用OCT技术测量激光焊接过程的匙孔深度,得出结论:当OCT的测量光束和匙孔准确对齐时,OCT技术可以准确稳健地测量匙孔的深度;并发现当激光焊接形成更深的匙孔和在更快的焊接速度下,匙孔会发生弯曲,此时利用OCT检测匙孔深度时应考虑匙孔的曲率。为了提取实际的焊缝深度,XIE等人[14]提出了一种基于局部离群因子(local outlier factor,LOF)和最大值滤波的OCT熔深曲线提取方法。

    熔深是焊缝宏观尺寸的重要参数,也是评价焊缝质量的重要指标,本文中对OCT技术的激光匙孔焊熔深检测方法进行了深入研究。OCT技术为直接测量激光焊接匙孔深度提供了解决方案,但匙孔焊产生的液相和气相的剧烈振荡会对OCT传感信号产生干扰[15],需要对OCT原始数据进行相应的滤波处理才能提取出准确的熔深曲线。当前的去噪滤波算法有很多,先前的研究表明,百分位滤波算法能从OCT原始散点数据中提取出与实际熔深吻合度较高熔深曲线。本文作者在应用百分位滤波算法对OCT原始散点数据进行处理的过程中发现,该方法提取的百分位熔深曲线存在尖峰扰动,这种扰动影响了熔深曲线精度。针对上述现象,提出了百分位滤波加移动平均算法的OCT熔深曲线提取方法,该方法在百分位滤波提取百分位熔深曲线的基础上,应用移动平均算法对其进行低通滤波处理,获得最终OCT熔深曲线。将最终OCT熔深曲线与实际焊缝纵抛面熔深曲线进行对比,验证了该方法的适用性和精确性。

1.   实验原理
  • OCT技术主要基于低相干干涉原理,光波在空间中相遇而得到加强或削弱,从而生成光波强弱分布的现象。OCT熔深检测系统的熔深信息由干涉频谱分析得来,随着物臂与参考臂距离的增加,条纹图的调制具有更高的空间频率。快速傅里叶变换可以区分被测频谱的频率,以此来确定被测物体的空间位置信息。

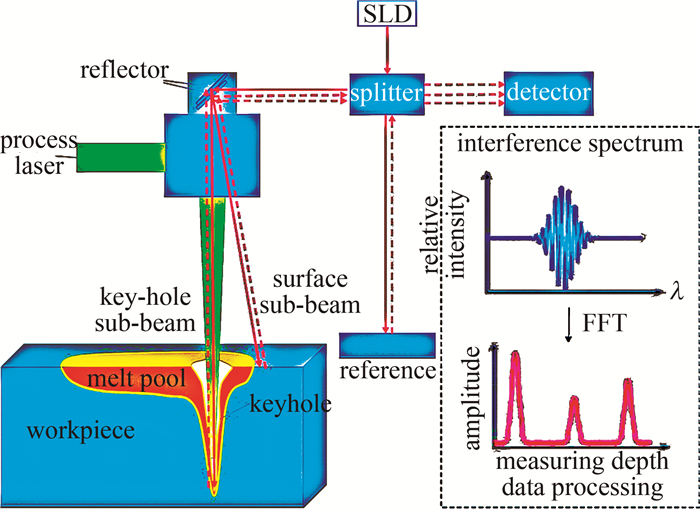
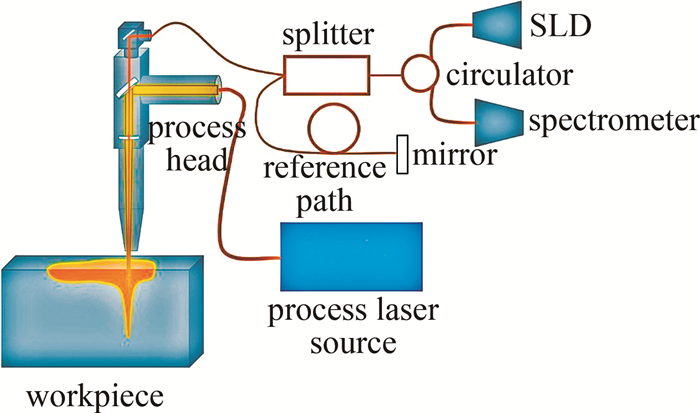
    OCT熔深检测系统主要包括超辐射发光二极管(super luminescent diode,SLD)、光纤耦合器、物臂(测量臂)、参考臂和光谱仪等部件。测量原理如图 1所示,SLD发出宽带光源,通过分束器引导一部分光通向参考路径,其被反射镜反射回光谱仪;SLD输出的另外一部分光被引导指向加工头,通过光学准直器与加工激光束叠加后聚焦到工件上。在本文中应用的OCT系统,通过两个可调角度的光学反射镜片将测量臂的测量光分割成两束光束:一束光束与激光焊接光束同轴,随着激光光束一同到达匙孔的底部形成散射光后原路返回;另一束光束通过调节反射镜角度指向焊接工件的上表面,形成“匙孔映射”,有助于确定OCT测量光束的最佳位置[16]。测量光和参考光返回至光纤耦合器,并发生干涉,由光谱仪线阵相机记录光谱干涉条纹图,对得到的光谱干涉图做快速傅里叶变换(fast Fourier transform,FFT)即可得到测量光束的深度位置信息。由于两个子光束干涉同一个参考臂,因此得到的干涉图样既包含匙孔底部的位置信息,又包括工件表面的位置信息。设置工件表面基准,便于直接量化匙孔深度。

    Figure 1.  Schematic diagram of OCT laser weld depth monitoring system

  • 在激光匙孔焊过程中,OCT系统的测量数据呈散点分布,由于匙孔形态的不断变化、熔池的动态涌动和熔融金属蒸发产生的金属蒸气等,所以存在某些时刻的OCT匙孔测量光束无法到达匙孔底部,称为无效的熔深信息,需要进一步对无效的熔深信息进行滤波处理,得到较为真实熔深测量数值。本文中基于百分位滤波加移动平均算法进行OCT原始数据去噪拟合处理。

    百分位滤波也叫排序滤波,是一种基于排序原理的非线性平滑技术[17]。百分位滤波是以移动中心平窗的方式进行计算的,主要有两个参数需要设置:移动中心平窗的大小τ和百分位数p[18]。假设在某一时刻t,而在t前后τ/2时间段内的全部测量值L为:

    式中:τ为滤波窗口大小;Δt为两个深度测量值之间的周期。百分位滤波函数将集合L的全部测量值D(t)进行排序处理,意味着在t时刻的测量深度值用集合Lp百分位数的数值Dp(t)代替,即集合L内的测量值有p%的测量值小于Dp(t),最后以移动中心平窗的方式遍历全部的测量数值获得百分位滤波曲线。

    式中:F[D(t)] 相当于百分位函数,对τ窗口范围内的全部深度测量值(即集合L内全部元素)进行百分位滤波运算。针对百分位滤波曲线存在的尖峰干扰现象,利用移动平均算法(moving average,MA)滤除曲线中的高频成分。MA以中心平窗方式进行计算的,它可以有效去除曲线中的高频扰动噪声,保留有用的低频趋势。MA需要设置的参数有移动窗口大小T,假设在任意t时刻通过百分位滤波算法获得的熔深数值为Dp(t),则在t时刻的前后T/2时间内通过百分位滤波算法获得的熔深数值集合D(t)为:

    移动平均算法是用集合D(t)中元素的算术平均值D代替通过百分位滤波算法提取的熔深数值Dp(t),最后采用移动窗口方法遍历全部的熔深数值拟合出熔深曲线。

2.   激光焊接熔深测量实验
  • 为了实现激光焊接的熔深在线检测,并验证上述方法的可行性,通过OCT熔深检测系统对304不锈钢激光匙孔焊过程进行检测,获得实时的OCT熔深检测数值。应用百分位滤波算法对原始数据进行初步处理,再利用移动平均算法对百分位滤波熔深曲线进行处理,获得最终的OCT熔深曲线。精细磨抛获取焊缝纵抛面的实际熔深曲线,通过拟合曲线和实际焊缝曲线的对比,多次实验验证拟合曲线的测量精度。

  • 激光焊接匙孔焊熔深在线检测实验装置示意图如图 2所示。主要包括了激光焊接系统和OCT熔深检测系统,其中激光焊接系统采用的激光器是单模准连续光纤激光器,激光器的最大功率为2000 W, 激光光束中心波长为1.08 μm,光束质量(beam parameter product,BPP)为1.5 mm·mrad。激光头和工作台面竖直方向倾斜形成一定角度。OCT熔深检测系统采用SLD作为辐射光源,测量光束与加工光束共用聚焦镜,测量光束与加工光束同轴对准,采样率80 kHz/s。焊接工件使用夹具平放夹持在工作台面,保护气体使用氩气直吹。

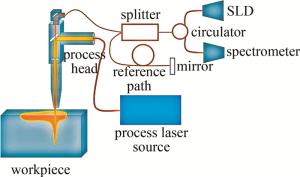
    Figure 2.  Schematic diagram of the experimental setup

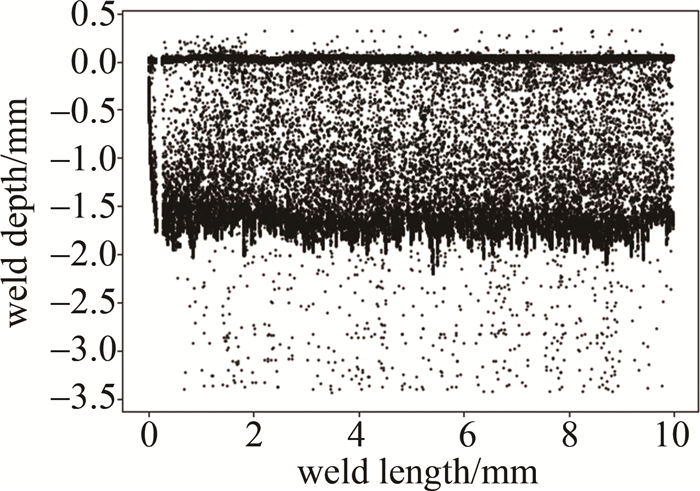
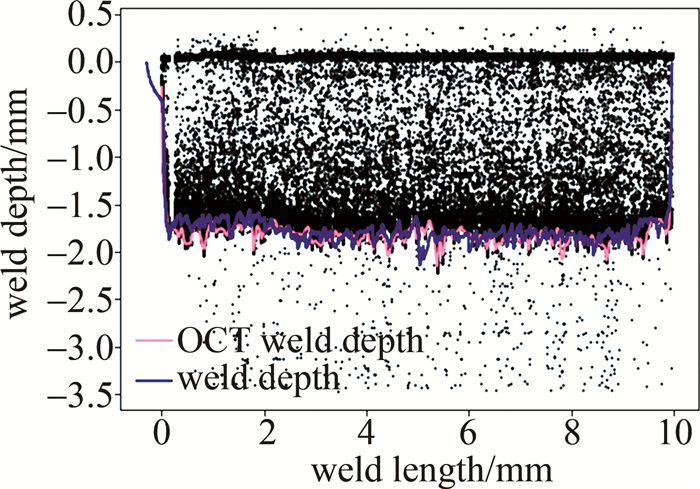
  • 在激光功率为500 W、焊接速率为20 mm/s、加工光束聚焦于工件表面(离焦量为0 mm)时,使用上述激光焊接设备对3 mm厚的304不锈钢进行堆焊(实验样例A),OCT检测系统记录样例A的整个焊接过程。图 3是OCT系统生成的原始测量数据。图中的每一个黑点代表着每一时刻的深度测量。通过OCT系统的系统参数,采样率与焊接速率进行核算,x轴方向代表焊缝的长度,y轴方向代表焊缝深度。OCT系统通过激光反射信号进行触发采集,所以系统的数据产生和焊接过程同时开始,同时停止。深度定义为工件表面以下为负,工件表面以上为正。y轴方向焊缝深度测量结果为0 mm处的黑色散点集中呈1条直线,这是板材表面的基准测量;x轴方向0 mm~0.1 mm显示的是匙孔的生成过程,在0.1 mm后,匙孔稳定,显示的是匙孔深度的测量结果,形成一定长度的焊缝后,在焊缝长度为10 mm处关闭激光,OCT系统测量即结束。

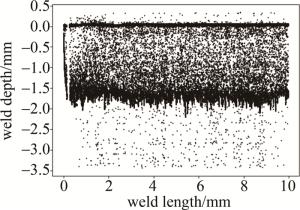
    Figure 3.  OCT weld depth measurement result

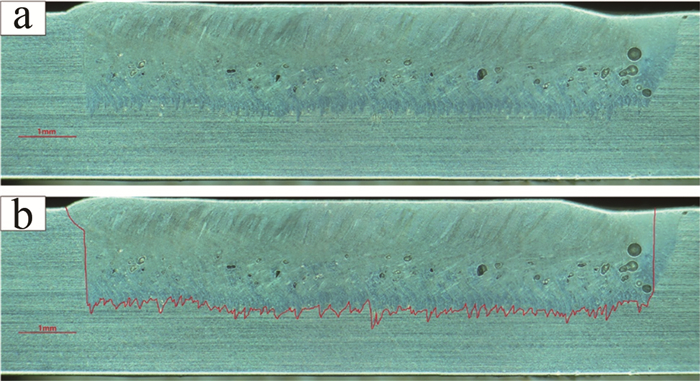
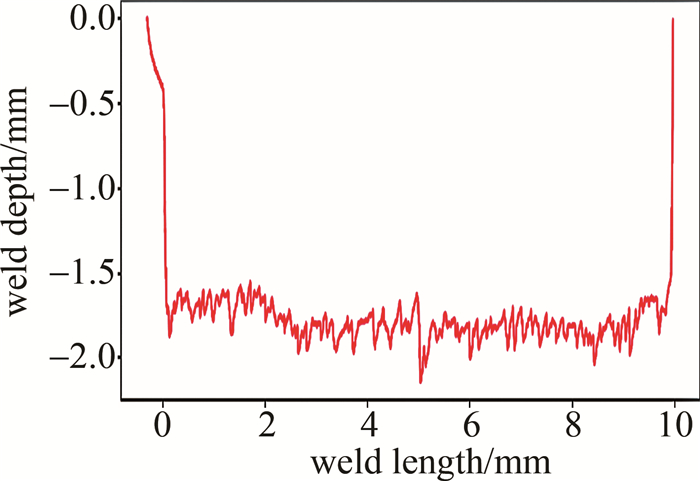
  • 为了验证通过百分位滤波和移动平均算法拟合出的熔深曲线精度,对样例A的焊缝实物沿着焊缝纵向剥开,通过精细磨抛,磨抛至焊缝的正中间。电子显微镜拍摄焊缝纵抛面的金相图片,并通过图像全景拼接算法,获得整个焊缝纵抛面的金相图片如图 4a所示。纵抛面的金相图片显示,焊缝与原来的工件材料存在明显的分界线,沿焊缝中心线纵抛面上显示出大量的气孔,这是典型的匙孔型气孔。在实物金相图片上,准确识别焊缝与工件的边界,实际熔深曲线如图 4b中红线所示。对图 4的图像进行减法处理,提取实际熔深曲线,在确定金相图片与实物之间的比例尺的情况下,对实际焊缝深度曲线数值化,数值化结果如图 5所示。

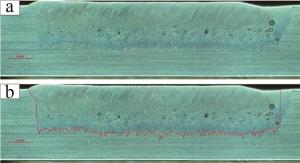
    Figure 4.  Metallographic picture of the longitudinal throwing surface of the weld of sample A

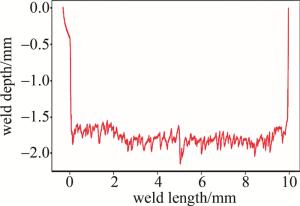
    Figure 5.  Sample A weld depth curve numerical results

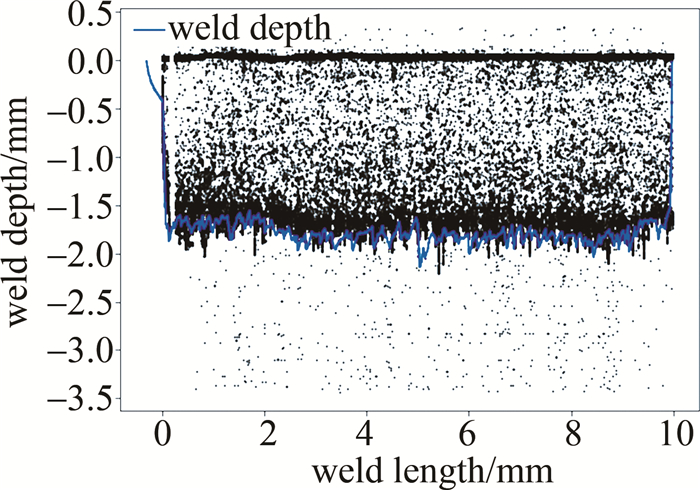
  • OCT熔深检测系统采集到的原始数据与实际焊缝深度曲线对比如图 6所示。图中,黑色散点表示OCT熔深检测系统的测量值,蓝色线表示焊缝纵抛面的实际焊缝深度。可以看出,OCT系统对工件表面的测量结果集中在0 mm处,能够实现精确的工件表面测量,但对匙孔的测量结果分散在很宽的范围内,并不能直接明确地揭示真实的匙孔深度。对比实际焊缝深度曲线,大部分测量点位于实际焊缝深度上方,少量测量点位于实际焊缝深度的下方。位于实际焊接深度上方的噪点可能是因为OCT测量光束未到达匙孔底部,碰到匙孔壁或飞溅等即反射回OCT检测系统造成的;位于实际焊缝深度下方的测量点主要来自于系统噪声或者匙孔测量光束在匙孔内部多次反射导致光程长度的增长;少量的偏差也可能来自于实际焊缝深度曲线没能从焊缝正中间位置准确取下。

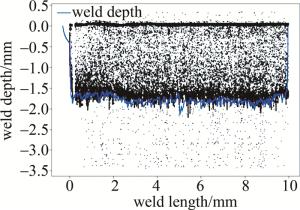
    Figure 6.  Comparison of OCT raw data and actual depth of fusion curves

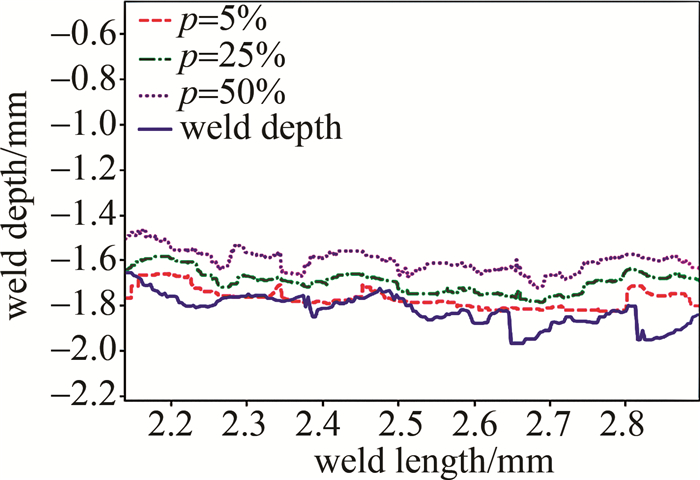
  • 为了从原始散点数据中提取出与实际焊缝深度一致的OCT熔深曲线,应用百分位滤波对OCT熔深检测系统采集到的原始数据进行处理。百分位滤波算法的窗口长度设置为200,百分位数p分别设置为5%、25%和50%,用于样例A的匙孔测量数值进行焊缝深度提取,得到如图 7所示的滤波深度轨迹。

    Figure 7.  Local comparison of weld depth curves at different percentiles with actual weld depth curves

    在样例A中,当p=5%时提取的OCT熔深曲线与实际熔深曲线吻合最好。实验证明:通过设置合适的百分位滤波参数能够提取出与实际熔深较一致的熔深曲线。p=5%时,百分位滤波算法提取的熔深曲线与实际焊缝熔深曲线的全局对比如图 8所示。从图 8可以看出,百分位滤波曲线出现了一些尖峰,这可能是匙孔坍塌形成气孔的标志,因为从样例A的纵向抛面金相图片也发现了孔隙。参考文献[19]中讨论了OCT数据的不规则性,可能与其通过高速X射线成像同时观察到的孔隙的形成相关。

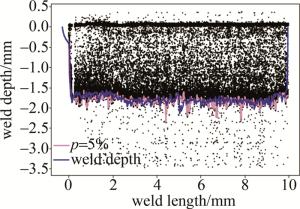
    Figure 8.  Global comparison of weld depth extracted by percentile filter p=5% with actual weld depth

  • 为了降低百分位滤波提取的熔深曲线中尖峰干扰的影响,应用本文中提出的移动平均算法对百分位滤波曲线进行低通滤波处理。实验中,移动平均算法的移动窗口大小设置为300,如图 9所示。图中,红色曲线是通过百分位滤波算法加移动平均算法共同处理下的熔深拟合曲线,它与实际焊缝深度曲线变化基本一致,但值得注意的是,对比实际焊缝深度曲线,红色曲线的变换趋势略滞后于实际焊缝深度曲线(蓝色曲线),这与激光头与工作台面竖直方向呈一定角度有关。参考文献[20]中也提到激光入射角度会对OCT测量信号产生影响。

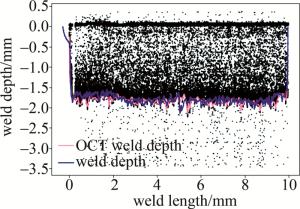
    Figure 9.  Weld depth curve extracted based on percentile filtering p=5% and moving average algorithm

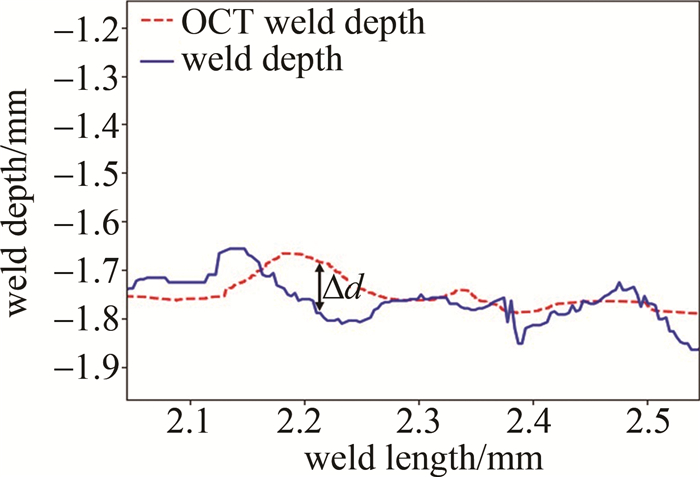
  • 为了验证本文中所提出的百分位滤波和移动平均算法在提取OCT熔深曲线中的适用性及精度的提升,分析了从OCT信号中提取的熔深曲线与从焊缝纵抛面提取的实际焊缝深度曲线之间的差异Δd,如图 10所示,并引入平均误差的概念来评估拟合曲线[18]。平均误差为:

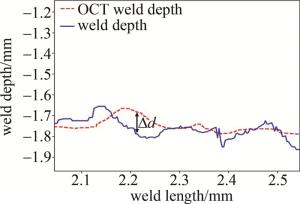
    Figure 10.  Evaluation of the difference between the fitted curve and the actual melt depth curve

    式中:Δdi是在离散测量第i点处测量深度与实际焊缝深度之间的差值;n是考虑的测量点数;d是实际焊缝深度曲线的平均焊缝深度,只包含焊缝深度不等于0的情况,用来量化提取深度的准确性。该定义反映了每个测量深度的平均偏移量。

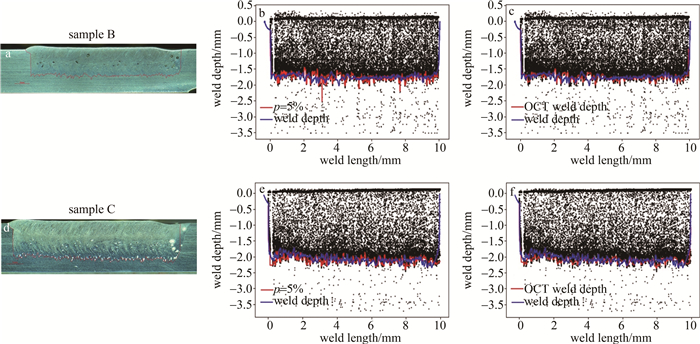
    使用该方法和相同的参数,即百分位滤波窗口大小设置为200,百分位数p=5%,移动平均算法的窗函数设置为300,得到样例B和样例C的OCT熔深检测实验曲线。获得样例B的焊接功率为500 W,焊接速率为20 mm/s;获得样例C的焊接功率为560 W,焊接速率为20 mm/s。图 11a是样例B焊缝纵抛面的实物金相图;图 11b是样例B通过百分位滤波拟合出的熔深曲线和实际熔深曲线;图 11c是样例B通过百分位滤波和移动平均算法拟合出的熔深曲线和实际熔深曲线;图 11d是样例C焊缝纵抛面的实物金相图;图 11e是样例C通过百分位滤波拟合出的熔深曲线和实际熔深曲线;图 11f是样例C通过百分位滤波和移动平均算法拟合出的熔深曲线和实际熔深曲线。将上述两种与实际熔深曲线对比进行平均误差分析,具体如表 1所示。实验证明,移动平均算法和百分位滤波可以较好地拟合出熔深曲线,且平均误差可以控制在5%以内。

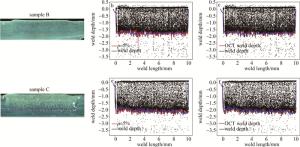
    Figure 11.  Metallographic images of sample B and sample C, weld depth curves extracted based on percentile filtering and weld depth curves extracted based on percentile filtering and moving average algorithm

    experimental sample percentile filter/% percentile filter+MA/% accuracy improvement/%
    sample A 4.93 4.21 15
    sample B 4.97 4.34 13
    sample C 4.53 4.09 10

    Table 1.  Average error of the three experimental samples

3.   结论
  • 提出了一种基于百分位滤波加移动平均算法的OCT熔深曲线去噪拟合方法,采用该方法提取的熔深曲线与实际焊缝深度曲线吻合度更高,可以实现激光焊接熔深的高精度测量。首先利用百分位滤波对OCT原始数据进行处理获得百分位滤波曲线,针对百分位滤波曲线存在的尖峰干扰,再利用移动平均算法对百分位滤波曲线进行低通滤波,最终拟合出OCT熔深曲线。将最终的OCT熔深曲线和实际熔深曲线进行平均误差对比计算,两者的平均误差处于5%以内。将拟合出的OCT熔深曲线与仅用百分位滤波算法提取的熔深曲线进行对比分析,曲线精度有所提升,且最大可提升15%。

Reference (20)

Catalog

    /

    DownLoad:  Full-Size Img  PowerPoint
    Return
    Return