 Map
Map


HTML
-
海洋光学参数与海水中的叶绿素、悬浮物、赤潮、营养盐等物质密切相关,海洋光学参数的时空变化对研究海洋碳循环、海洋生态有重要意义[1]。漫射衰减系数Kd是海洋光学参数中常用的一个表观光学量。目前用于测量漫射衰减系数Kd的方法主要包括原位测量和被动光学遥感。原位测量漫射衰减系数Kd虽然有很高的探测精度,但探测效率低,对极浅水域以及暗礁区域等船只无法抵达的区域探测存在盲区。被动光学遥感依靠飞机、卫星等平台,探测效率高,覆盖区域广,但是自然光穿水深度有限且缺乏时间维度信息,只能对30 m以浅的水体进行一个积分探测。近年来,激光雷达(ligth detection and ranging, LiDAR)用于海洋光学参数测量逐渐受到关注,由于其发射的蓝绿波段激光对海洋水体的穿透性高,回波携带时间维度信息能对海洋剖面进行直接探测,且搭载在飞机、卫星等平台,具备高时空分辨率、高效率、无盲区等优点,能够与原位测量和被动光学遥感技术形成相互补充,丰富海洋光学观测的数据层次[2-4]。
海洋激光雷达测量海洋光学参数的理论基础是海洋激光雷达方程。海洋激光雷达方程中的后向体散射系数β与衰减系数α这两个物理量表征光学参数且共同影响激光回波功率值,因而难以通过一个海洋雷达方程同时求解这两个物理量[5-8]。海洋光学参数的反演受水质因素影响显著,常用的方法包括Fernald法和Klett法[9-11]。Fernlad算法广泛适用于各类水质的水体,但其精度依赖于水质的先验信息,不同水质的水体需要选择不同的激光雷达比[9]。LIU等人基于Fernald法对漫射衰减系数Kd进行了反演研究,采用原位测量数据作为最优激光雷达比的确定依据[5]。但是全球海洋的原位探测数据稀疏不均匀,并且实时性不足,对全球大多数海区往往缺乏待测海域的水质先验信息和原位探测数据[10]。LIU等人通过Klett法研究了近岸和大洋水体叶绿素浓度剖面[12-15]。Klett法在浑浊水体条件下Kd值的求解与激光雷达无关,但是对Kd值的求解精度低于Fernald法[11]。
本文作者提出了一种反演水体漫射衰减系数Kd的融合算法,该方法适用于近岸浑浊水体,通过Klett法的Kd计算结果来选择待测水体的激光雷达比,再基于Fernald法对Kd进行精确求解,这种方法不依赖于原位测量数据,能够广泛应用于全球近岸水体的Kd测量,并且反演精度优于单一Klett法的反演结果。为了验证算法的有效性,采用自主研发的双频(近红外、绿光)海洋激光雷达,在某水域开展了近岸浅海水域的光学参数垂直廓线探测试验。本次实验中采用的是岸基平台,水体的水质条件单一,激光雷达的测点密度稀疏,空间离散型大,因而需要大量的仿真数据作为Kd反演算法的验证数据源。使用Walid解析模型产生不同水质条件下的激光雷达回波波形作为仿真数据源,并通过相同水质条件下的激光雷达回波信号对比验证Walid模型数据的有效性。最后,将融合算法用于仿真波形和实测波形的反演验证,结果证明了融合算法具备高精度反演Kd的能力。
-
海洋激光雷达方程用于描述激光在海水中的辐射传输特性,激光器向海洋发射蓝绿激光脉冲,经大气、气海界面、海水介质,最后被探测器接收。海洋激光雷达方程中表征水体光学特性主要参数是海水后向体散射系数β和激光雷达衰减系数α,把其它常数因子归集为因子A,因此激光雷达方程可以表示为[6]:
式中: $A$为激光雷达系统常数, $A=P_{\mathrm{e}} T_{\mathrm{atm}}{ }^2 A_{\mathrm{r}} \eta_{\mathrm{e}} \eta_{\mathrm{r}} F(1-$ $\left.L_{\mathrm{s}}\right)^2 ; P_{\mathrm{e}}$为激光发射功率; $T_{\mathrm{atm}}{ }^2$为双向大气衰减; $A_{\mathrm{r}}$为接收望远镜面积; $\eta_{\mathrm{e}}$和$\eta_{\mathrm{r}}$为出射光学系数和人射光学系数; $F$为望远镜视场损失因子; $L_{\mathrm{s}}$为海表传输损失; $\beta(z)$为后向体散射函数; $\alpha(z)$为激光雷达衰减函数, 下标$\mathrm{p}$和$\mathrm{w}$表示水体悬浮颗粒物和海水分子; $z$为海水深度; $z^{\prime}$表示积分里对应的$z$值; $n$为海水折射率; $H$为距水面高度。当激光雷达系统的接收视场足够大, 水体的漫射衰减系数$K_{\mathrm{d}}$近似等于激光雷达的衰减系数[12]。因此, 激光雷达衰减系数$\alpha$的测量结果等同于水体漫射衰减系数$K_{\mathrm{d}}$ :
-
海洋水体漫射衰减系数Kd是重要的海洋光学参数,可以用于初级生产力、叶绿素含量、颗粒有机碳含量等的评估[15]。从一个海洋激光雷达方程中求解两个未知光学参数存在困难,因此在反演漫射衰减系数Kd时需要设计合适的算法。目前比较成熟的反演算法为Fernald法和Klett法。
Fernald法需要对激光雷达比有先验信息,即假设的激光雷达比为常数,具体表示为:
式中: S为所假设的激光雷达比。当假设的激光雷达比选取准确时,反演激光雷达的衰减系数精度更高。但是不同区域水体悬浮物的激光雷达比差异大,对经验的依赖度高, 其迭代格式如下所示[9]:
式中: Sp和Sw分别表示水体悬浮物激光雷达比和海水分子激光雷达比,本文中纯水光学特性为已知量,纯水激光雷达比Sw近似为216 sr; αw(I)近似采用纯水的漫射衰减系数为0.0519 m-1[8]; X(I)和X(I-1)均表示距离修正的回波信号; I为迭代次数; K(I-1, I)=(Sw-Sp) ΔZ; ΔZ为每次迭代距离间隔。针对近岸浅海水域,考虑到当αp(I)$\gg $αw(I)时,因此可以忽略αw(I)Sp/Sw项的影响,则式(4)可以改写成式(5),得到Klett法迭代格式[11]:
Fernald算法是目前比较成熟的用于反演漫射衰减系数Kd的后向迭代算法,影响其算法精度的主要因素就是所假设的激光雷达比。Klett算法没有分开考虑纯海水和海水悬浮颗粒物,理论上其精度不如Fernald算法,但是在近岸海域,水体悬浮颗粒物的Kd值远大于水分子的Kd值时,求解出的水体悬浮颗粒物的漫射衰减系数Kd的精度接近于Fernald算法,且在反演漫射衰减系数时不依赖于所假设的激光雷达比。因此, 综合利用两种算法的优点,针对近岸浅海水域,本文作者提出了一种基于Fernald和Klett算法的融合算法,算法流程如图 1所示。该融合算法以Klett法反演结果为基准,计算出激光雷达比作为Fernald法迭代时的先验信息,最后用Fernald法反演出更加精确的水体漫射衰减系数Kd。具体来说:(a)输入标定值α0,基于Klett方法求解出一个精度较粗略的激光雷达衰减系数αk; (b)基于Fernald法中设置不同的水体悬浮物激光雷达比Si作为输入条件,计算出不同激光雷达比条件下对应的激光雷达衰减系数αi; (c)将其中与αk最接近的αi记作αf,与其对应的Sf作为最佳激光雷达比; (d)将最优的激光雷达比Sf和αf作为初始值代入Fernald法,迭代计算出激光雷达的衰减系数α,求解出水体光学参数Kd。
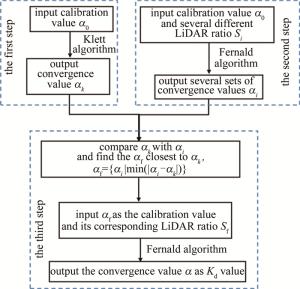
Figure 1. Flow diagram of fusion algorithm
-
由于海试数据测点密度稀疏,空间离散型大,为了验证融合算法的有效性,需要大量的仿真数据作为融合算法反演Kd的验证数据源。近年来,学者们发展了不同形式的海洋激光雷达方程来建立激光雷达回波功率与海水深度、海水衰减系数、后向散射系数之间的联系[16-19]。在目前常用的海洋激光雷达回波数学模型中,Walid模型全面考虑了发射激光的脉冲展宽、激光雷达系统参数、海水特性和各种噪声,适合用此模型作为验证融合算法有效性的仿真数据源,下面简要介绍Walid模型的表达形式。
式中: $P_{\mathrm{t}}(t)$为接收回波功率总功率; $P_{\mathrm{s}}(t)$为海表回波功率; $P_{\mathrm{c}}(t)$为海水回波功率; $P_{\mathrm{b}}(t)$为海底回波功率; $P_{\mathrm{g}}(t)$为背景噪声的回波功率; $P_{\mathrm{n}}(t)$为探测器噪声回波功率; $t$为时间范围。本文中研究的水体光学参数主要影响海洋激光雷达的海水回波, 海水回波的表达形式可以看作是高斯发射光束与水深$z$处海水回波功率的卷积[20-22], 具体形式为:
其中定义w(tc)为:
式中: tc为高斯光束从海水到探测器的双程时间; T0为脉冲宽度。
海水中太阳辐射背景噪声回波功率被定义为一个高斯白噪声(均值为0,标准差为1),其与一个冲击响应Pg的卷积[16]:
式中: Is为从海水中反射回来的太阳辐射;Δλ为接收光学滤波带宽;γr为接收遮拦比。
探测器内部噪声被定义其均值为0,其标准差为σn(t)的随信号水平变化的正态分布[16]:
式中: Pext(t)=Pg(t)+Ps(t)+Pc(t)+Pb(t);e为电子电荷;B为探测器电子带宽;G为过量噪声因素;Id为暗电流;Rλ为响应率。
1.1. 海洋激光雷达方程
1.2. 基于Klett法和Fernald法的融合算法
1.3. 解析回波模型
-
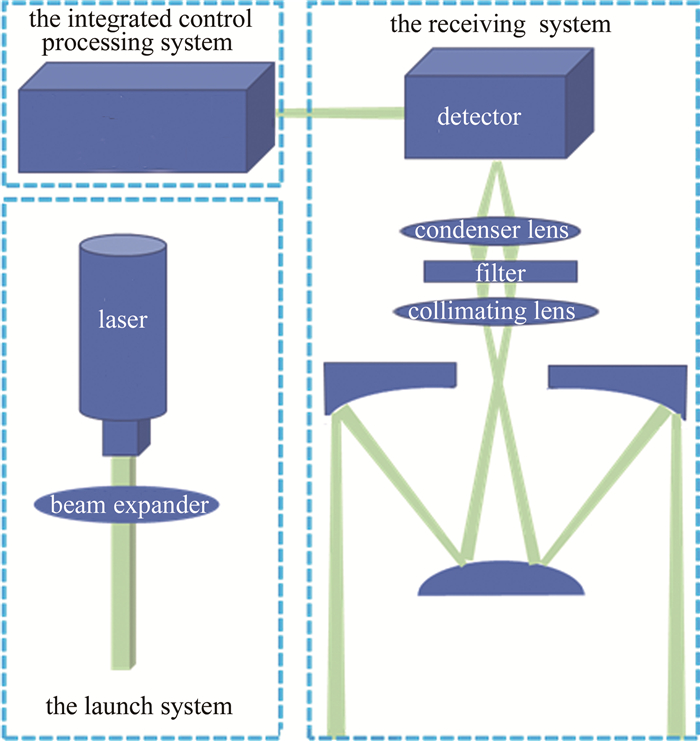
本文作者采用的双频海洋激光雷达系统主要由发射系统、接收系统以及综合控制处理系统三大部分构成,如图 2所示。发射系统采用532 nm/1064 nm的Nd ∶YAG双频脉冲激光器,波长为1064 nm的脉冲激光器发射的激光无法透过海水,用于判断海表的位置。波长为532 nm的脉冲激光器出射能量为3 mJ,脉宽约为10 ns,重频10 Hz,经过发射光路扩束后激光射入水中,经海水的散射和海底的反射后被探测器接收。接收系统的望远镜采用口径为200 mm的R-C(Richey-Chretien)光学系统的望远镜,视场约50 mrad。光电探测器进行距离选通和放大增益调节,由光电倍增管和雪崩二极管组成,用于接收海表通道和海水通道,以满足各个探测通道的不同探测需求。综合控制处理系统具有控制、采集、存储及处理等功能,采集卡的采样频率为5 GHz,采样间隔为0.2 ns。主要参数见表 1。
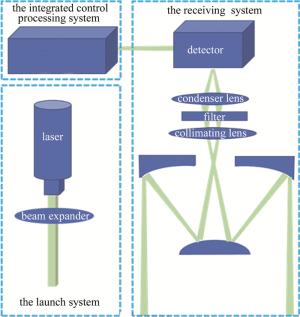
Figure 2. Schematic of the marine LiDAR system
parameter value parameter value wavelength 532 nm/1064 nm pulse energy 3 mJ pulse width 10 ns repetition frequency 10 Hz excessive noise factor 3 electronic bandwidth 300 MHz input optical efficiency 0.5 dark current noise 10-8 A sample interval 0.2 ns sample rate 5 GHz Table 1. LiDAR system parameters
-
解析模型的系统参数主要来自自研的激光雷达系统,海水环境参数如海表损失因子,海水的散射系数由对海域的原位测量给出,具体仿真模型参数见表 2。
parameter value parameter value λ 532 nm β 0.0015/(m·sr) H 200 m Is 0.025 W/(m2·sr) Pe 2×10⁷ W nw 1.34 T0 10 ns G 3 Tatm2 0.9 Id 10-8 A Ar 0.025 m2 Rλ 0.3 A/W ne 0.9 Δλ 1 nm nr 0.5 γr 0.15 F 1 B 300 MHz e 1.6×10⁻¹⁹ C E0 3 mJ Table 2. Numerical parameters for simulation models
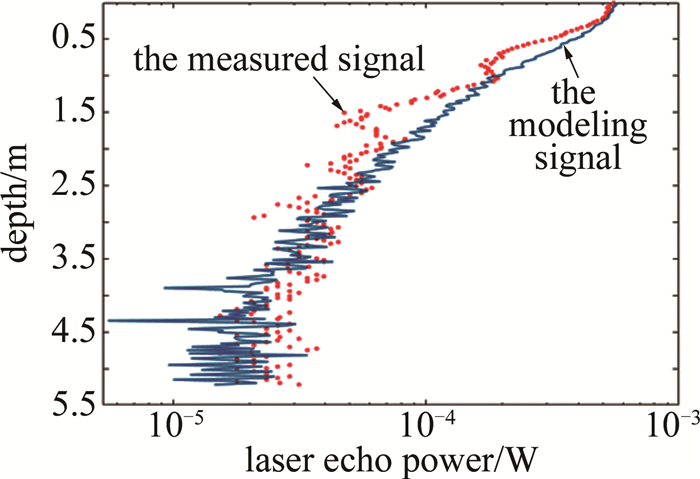
为了验证仿真波形的有效性,针对同一水质Kd=0.32 m-1条件下,进行了建模信号与实测信号的吻合性比较,如图 3所示。

Figure 3. Comparison chart of measured and simulated LiDAR echo signals
利用Walid模型[16]仿真了该区域的激光雷达回波信号,如图 3中建模信号蓝色实线所示,海水实测回波信号如图 3中红色散点所示[23-25]。1.5 m以内的实测信号可能受到海表海浪、气泡等因素的影响,有信号失真的情况,将舍去这部分信号。建模信号在1.5 m以下能够很好地复现实测信号,Walid模型对实测水体的激光回波的模拟具有良好效果。因此,Walid建模波形能够作为反演算法的数据源。
-
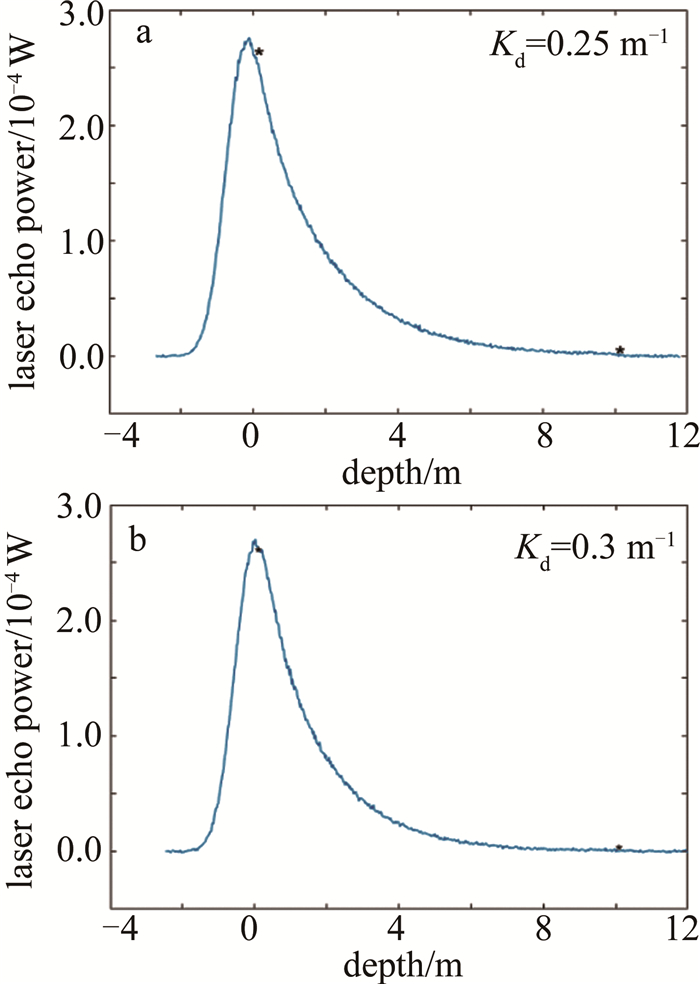
采用Walid模型在不同Kd值的情况下进行了融合算法的仿真验证分析, 以设置Kd值为0.2 m-1和0.3 m-1为例,利用融合算法对仿真波形进行了反演Kd值的验证。
两组仿真波形如图 4所示。图中黑色标记点分别代表海表、海底回波信号位置,仿真波形分别设置的Kd值为0.25 m-1和0.3 m-1,海水深度10 m。迭代过程中受到海表脉冲展宽和海浪因素等影响,取距离海面1 m深度处为收敛值。如图 5所示, 首先利用斜率法求出海底处位置的Kd值,因为海底波形有脉冲展宽影响,因此,以约9.5 m处用斜率法得到的初始值进行后向迭代;然后使用Klett法反演出Kd值的收敛曲线,设置不同水体悬浮物的激光雷达比,得出Fernald法的反演曲线。计算出Kd=0.25 m-1处的最佳激光雷达比为160 sr;Kd=0.3 m-1处的最佳激光雷达比为200 sr。从反演曲线图可知,Kd设置为0.25 m-1处的融合算法第1步收敛值为0.254 m-1;Kd设置为0.3 m-1处的融合算法第1步收敛值为0.307 m-1。利用得到收敛的Kd值和最佳激光雷达比作为Fernald法下一步迭代的初始值,最后得出融合算法的反演曲线, 如图 6所示。
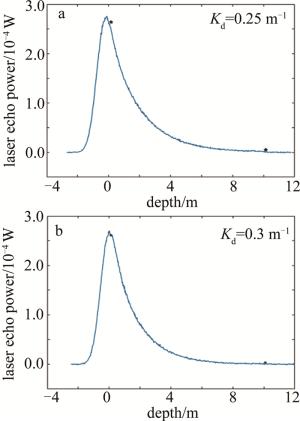
Figure 4. Simulated echo signal
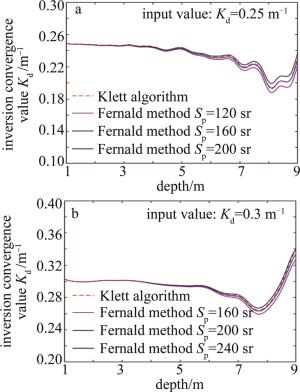
Figure 5. Inversion results of Klett algorithm and Fernald method with different LiDAR ratios in simulation
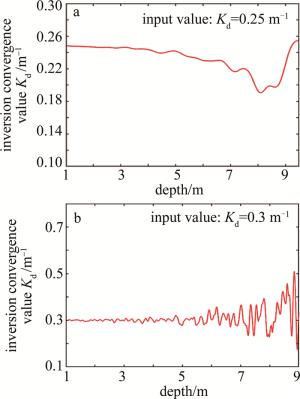
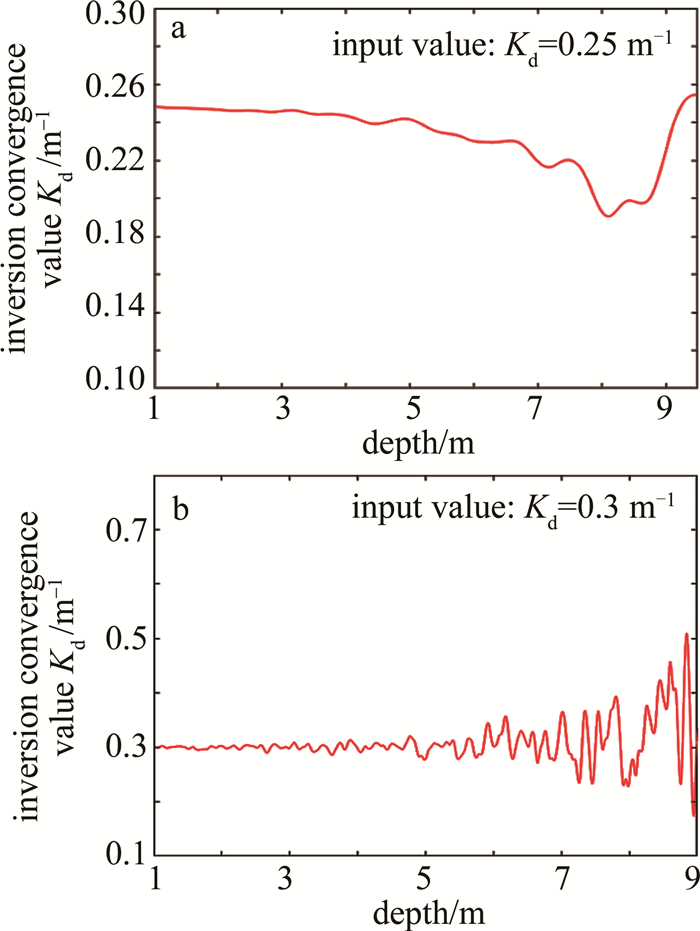
Figure 6. Diagram of inversion Kd value of fusion algorithm in simulation
由图 6可知,利用融合算法得到的Kd值设置为0.25 m-1处的融合算法收敛值为0.249 m-1,融合算法得到的Kd值设置为0.3 m-1处的融合算法收敛值为0.301 m-1。使用均方根误差(root mean square error, RMSE)来衡量算法反演的精度。当Kd设置为0.25 m-1时,计算得到Fernald法的RMSE为0.105 m-1,Klett法的RMSE为0.103 m-1,融合算法的RMSE为0.098 m-1;当Kd设置为0.3 m-1时,计算得到Fernald法的RMSE为0.975 m-1,Klett法的RMSE为0.984 m-1,融合算法的RMSE为0.957 m-1。仿真结果显示出融合算法在近岸水域反演漫射衰减系数Kd的优势。
-
2021年10月在某水域开展了海洋激光雷达探测漫射衰减系数的实验。
实验平台为岸基扫描平台,双频激光雷达设备以向水中发射脉冲激光,并进行小区域扫描。激光经由海面、海水、海底的反射被探测器接收。同时,采用某自由落体式高光谱辐射剖面测量系统采集,获得高精度的向下辐照度,计算Kd值(漫射衰减系数)的公式为Kd(z)=-(dEd/dz)/Ed, Ed为下行辐照度。将得到原位测量数据进行一次拟合,计算得到此海域Kd =0.32 m-1,利用原位测量得到水深为5.5 m。
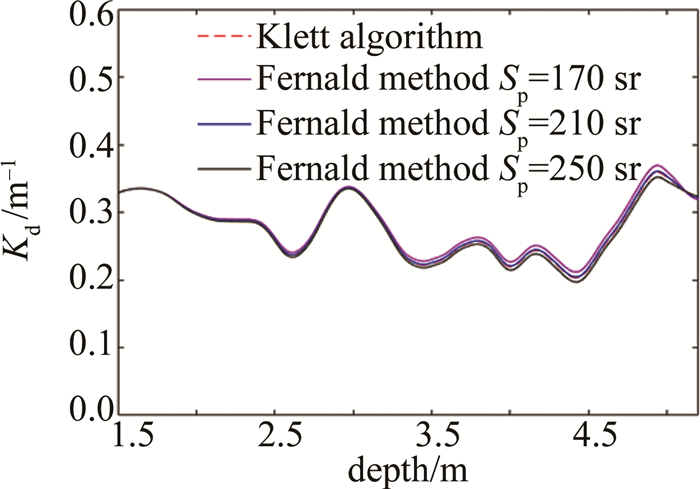
实测信号采用某水域的海试数据,其近岸浅水深度约为5.5 m,迭代初始值利用斜率法计算海底处的Kd值,考虑到海底处的脉冲展宽会使海底有一个突起的波峰,因此选用5.2 m处作为迭代初始位置。首先利用Klett算法反演出Kd值曲线,然后分别用不同激光雷达比的Fernald算法得出反演Kd的曲线,从Kd=0.317 m-1处迭代,在1.5 m深度Kd收敛到0.325 m-1左右。图 7中显示了Klett算法最为接近的水体悬浮物激光雷达比为210 sr,以此为依据作为Fernald法最后迭代的初始值。
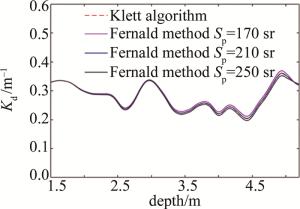
Figure 7. Inversion results of Klett algorithm and Fernald method with different LiDAR ratios in experiment
融合算法最后反演出的Kd收敛值如图 8所示。融合算法反演结果与原位测量拟合数据在1.5 m处收敛值一致,测得此近岸海域最佳激光雷达比为210 sr,海水Kd=0.317 m-1。针对同一实测波形,Klett算法反演Kd值的RMSE为0.85 m-1, Fermald算法反演Kd值的RMSE为0.8 m-1,融合算法反演Kd值的RMSE为0.74 m-1。实验结果进一步验证了所提出的融合算法的有效性,表明了此算法可以很好地反演漫射衰减系数Kd。
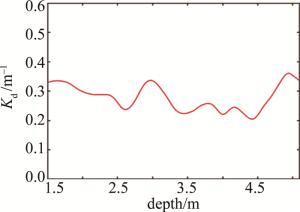
Figure 8. Diagram of inversion Kd value of fusion algorithm in experiment
2.1. 海洋激光雷达系统
2.2. 仿真波形的产生
2.3. 仿真波形反演结果

2.4. 实测波形反演结果

-
针对近岸浅海水域,提出了一种基于Fernald法和Klett法的融合算法,该融合算法以Klett法反演结果为基准,将计算出的激光雷达比作为Fernald法迭代时的先验信息,最后用Fernald法反演出更加精确的水体漫射衰减系数Kd。利用解析模型仿真了激光雷达回波信号,通过设置与海试环境一致的环境参数和系统参数, 验证了融合算法的可行性,将融合算法应用于仿真波形数据和实测波形数据,通过与原位测量数据比较,利用融合算法反演得到Kd值的RMSE为0.74 m-1,精度优于传统的Klett法和Fernald法。实验结果表明,所提出的融合算法在近岸水体条件下能够快速找到水体悬浮物激光雷达比, 并能准确反演出Kd值。
 DownLoad: