Advanced Search

ISSN1001-3806 CN51-1125/TN Map

Volume 48 Issue 3
May  2024
Article Contents
Turn off MathJax

Citation:

Quantitative study of brass based on calibration-free laser-induced breakdown spectroscopy

  • Corresponding author: YU Yang, yuyang@hgnu.edu.cn
  • Received Date: 2023-06-30
    Accepted Date: 2023-07-18
  • In order to realize the rapid quantitative detection of copper and zinc in brass samples, three brass samples were studied by calibration-free laser-induced breakdown spectroscopy(CF-LIBS). Six characteristic spectral lines of copper and four characteristic spectral lines of zinc were selected as the analysis objects. Under the spectrum acquisition modes of a single pulse and an average of 10 pulses, the relative standard deviation (RSD) of characteristic spectral lines of copper and zinc were comparatively analyzed. The results show that under the condition of an average of 10 pulses, the average RSD of copper and zinc is decreased by 8.8% and 12.3%, respectively, compared with the single pulse. The mass fraction of copper and zinc in three brass samples are quantitatively calculated by CF-LIBS, the relative errors between the temperature of copper and zinc and the average plasma temperature are 5.2%, 0.9%, and 7.1%, respectively. The relative errors in copper mass fraction in the three samples are 5.6%, 0.5% and, 1.6%, respectively; The relative errors in zinc mass fraction are 9.2%, 2.0%, and 13.3%, respectively. CF-LIBS is expected to provide method support for the rapid and accurate detection of element mass fraction in brass and provide data and technical support for the further development of portable detection equipment for the element mass fraction of alloy samples.
  • 加载中
  • [1]

    KAUTZ E J, DEVARAJ A, SENOR D J, et al. Hydrogen isotopic analysis of nuclear reactor materials using ultrafast laser-induced breakdown spectroscopy[J]. Optics Express, 2021, 29(4): 4936-4946. doi: 10.1364/OE.412351
    [2] 余洋, 赵南京, 孟德硕, 等. 基于偏振分辨LIBS技术的土壤重金属检测研究[J]. 中国激光, 2018, 45(8): 0811001.

    YU Y, ZHAO N J, MENG D Sh, et al. Detection of heavy metals in soil based on polarization resolved LIBS technique[J]. Chinese Journal of Lasers, 2018, 45(8): 0811001(in Chinese).
    [3]

    QIN H Q, LU Zh M, YAO Sh Ch, et al. Combining laser-induced breakdown spectroscopy and Fourier-transform infrared spectroscopy for the analysis of coal properties[J]. Journal of Analytical Atomic Spectrometry, 2019, 34(2): 347-355. doi: 10.1039/C8JA00381E
    [4] 郝晓剑, 任龙, 杨彦伟, 等. 煤中激光诱导击穿光谱的碳元素定量分析[J]. 激光技术, 2020, 44(2): 232-236.

    HAO X J, REN L, YANG Y W, et al. Quantitative analysis of carbon in coal based on laser-induced breakdown spectroscopy[J]. Laser Technology, 2020, 44(2): 232-236(in Chinese).
    [5]

    YAO M Y, FU G R, XU J, et al. In situ diagnosis of mature HLB-asymptomatic citrus fruits by laser-induced breakdown spectroscopy[J]. Applied Optics, 2021, 60(20): 5846-5853. doi: 10.1364/AO.427856
    [6] 吴宜青, 刘津, 莫欣欣, 等. 共轴双脉冲激光诱导击穿光谱结合双谱线内标法定量分析植物油中的铬[J]. 物理学报, 2017, 66(5): 054206.

    WU Y Q, LIU J, MO X X, et al. Quantitative analysis of chromium in vegetable oil by collinear double pulse laser-induced breakdown spectroscopy combined with dual-line internal standard method[J]. Acta Physica Sinica, 2017, 66(5): 054206(in Chinese).
    [7] 佘明军, 付洪波, 贾军伟, 等. 激光诱导击穿光谱判定岩石陆相和海相沉积[J]. 光子学报, 2018, 47(8): 0847009.

    SHE M J, FU H B, JIA J W, et al. Determination of terrestrial and marine sedimentary rocks by laser-induced breakdown spectroscopy[J]. Acta Photonica Sinica, 2018, 47(8): 0847009(in Chinese).
    [8]

    DIAZ D, MOLINA A, HAHN D W, et al. Laser-induced breakdown spectroscopy and principal component analysis for the classification of spectra from gold-bearing ores[J]. Applied Spectroscopy, 2020, 74(1): 42-54. doi: 10.1177/0003702819881444
    [9] 邱苏玲, 李安, 王宪双, 等. 基于激光诱导击穿光谱的矿石中铁含量的高准确度定量分析[J]. 中国激光, 2021, 48(16): 1611002.

    QIU S L, LI A, WANG X Sh, et al. High-accuracy quantitatively analysis of iron content in mineral based on laser-induced breakdown spectroscopy[J]. Chinese Journal of Lasers, 2021, 48(16): 1611002(in Chinese).
    [10] 孙兰香, 王文举, 齐立峰, 等. 基于激光诱导击穿光谱技术在线监测碳纤维复合材料激光清洗效果[J]. 中国激光, 2020, 47(11): 1111003.

    SUN L X, WANG W J, QI L F, et al. Online monitoring of laser cleaning effect of carbon fiber composite materials based on laser-induced breakdown spectroscopy technology[J]. Chinese Journal of Lasers, 2020, 47(11): 1111003(in Chinese).
    [11] 李江涛, 鲁翠萍, 沙文. 复合肥中磷元素的激光诱导击穿光谱定量分析[J]. 激光技术, 2019, 43(5): 601-607.

    LI J T, LU C P, SHA W. Quantitative analysis of phosphorus in compound fertilizer by laser induced breakdown spectroscopy[J]. Laser Technology, 2019, 43(5): 601-607(in Chinese).
    [12]

    GUO J J, MAHMOUD A S, LI N, et al. Study of pressure effects on ocean in-situ detection using laser-induced breakdown spectroscopy[J]. Plasma Science and Technology, 2019, 21(3): 034022. doi: 10.1088/2058-6272/aaf091
    [13]

    YTSMA C R, DYAR M D. Accuracies of lithium, boron, carbon, and sulfur quantification in geological samples with laser-induced breakdown spectroscopy in Mars, Earth, and vacuum conditions[J]. Spectrochimica Acta, 2019, B162: 105715.
    [14] 蔡婷妮, 李春来, 任鑫, 等. 火星车载激光诱导击穿光谱仪(MarsCoDe)在轨定标样品选取研究[J]. 光谱学与光谱分析, 2019, 39(5): 1623-1629.

    CAI T N, LI Ch L, REN X, et al. Research on the selection of Mar sonboard laser induced breakdown spectrometer (MarsCoDe) calibration samples[J]. Spectroscopy and Spectral Analysis, 2019, 39(5): 1623-1629(in Chinese).
    [15]

    CIUCCI A, CORSI M, PALLESCHI V, et al. New procedure for quantitative elemental analysis by laser-induced plasma spectroscopy[J]. Applied Spectroscopy, 1999, 53(8): 960-964. doi: 10.1366/0003702991947612
    [16]

    SUN L X, YU H B. Correction of self-absorption effect in calibration-free laser-induced breakdown spectroscopy by an internal refe-rence method[J]. Talanta, 2009, 79(2): 388-395. doi: 10.1016/j.talanta.2009.03.066
    [17]

    DONG J, LIANG L, WEI J, et al. A method for improving the a-ccuracy of calibration-free laser-induced breakdown spectroscopy (CF-LIBS) using determined plasma temperature by genetic algorithm (GA)[J]. Journal of Analytical Atomic Spectrometry, 2015, 30(6): 1336-1344. doi: 10.1039/C4JA00470A
    [18] 张雷, 赵书霞, 孙颖, 等. 等离子体温度和谱线强度综合校准的CF-LIBS定量分析合金成分[J]. 中国科学: 物理学 力学 天文学, 2018, 48(1): 014201.

    ZHANG L, ZHAO Sh X, SUN Y, et al. Quantitative CF-LIBS ana-lysis of alloys via comprehensive calibration of plasma temperature and spectral intensity[J]. Scientia Sinica(Physica, Mechanica & Astronomica), 2018, 48(1): 014201(in Chinese).
    [19]

    LI T Q, HOU Z Y, FU Y T, et al. Correction of self-absorption effect in calibration-free laser-induced breakdown spectroscopy (CF-LIBS) with blackbody radiation reference[J]. Analytica Chimica Acta, 2019, 1058: 39-47. doi: 10.1016/j.aca.2019.01.016
    [20]

    HU Z L, CHEN F, ZHANG D, et al. A method for improving the accuracy of calibration-free laser-induced breakdown spectroscopy by exploiting self-absorption[J]. Analytica Chimica Acta, 2021, 1183: 339008. doi: 10.1016/j.aca.2021.339008
    [21]

    KRAMIDA A, RALCHENKO Y, READER J, et al. Nist atomic spectra database [DB/OL]. (2022-10-30)[2023-07-18]. https://physics.nist.gov/PhysRefData/ASD/lines_form.html.
  • 加载中
通讯作者: 陈斌, bchen63@163.com
  • 1. 

    沈阳化工大学材料科学与工程学院 沈阳 110142

  1. 本站搜索
  2. 百度学术搜索
  3. 万方数据库搜索
  4. CNKI搜索

Figures(9) / Tables(3)

Article views(1525) PDF downloads(12) Cited by()

Proportional views

Quantitative study of brass based on calibration-free laser-induced breakdown spectroscopy

    Corresponding author: YU Yang, yuyang@hgnu.edu.cn
  • 1. College of Physics and Electronic Information, Huang Gang Normal University, Huanggang 438000, China
  • 2. Hubei Key Laboratory of Optical Information and Pattern Recognition, Wuhan Institute of Technology, Wuhan 430205, China

Abstract: In order to realize the rapid quantitative detection of copper and zinc in brass samples, three brass samples were studied by calibration-free laser-induced breakdown spectroscopy(CF-LIBS). Six characteristic spectral lines of copper and four characteristic spectral lines of zinc were selected as the analysis objects. Under the spectrum acquisition modes of a single pulse and an average of 10 pulses, the relative standard deviation (RSD) of characteristic spectral lines of copper and zinc were comparatively analyzed. The results show that under the condition of an average of 10 pulses, the average RSD of copper and zinc is decreased by 8.8% and 12.3%, respectively, compared with the single pulse. The mass fraction of copper and zinc in three brass samples are quantitatively calculated by CF-LIBS, the relative errors between the temperature of copper and zinc and the average plasma temperature are 5.2%, 0.9%, and 7.1%, respectively. The relative errors in copper mass fraction in the three samples are 5.6%, 0.5% and, 1.6%, respectively; The relative errors in zinc mass fraction are 9.2%, 2.0%, and 13.3%, respectively. CF-LIBS is expected to provide method support for the rapid and accurate detection of element mass fraction in brass and provide data and technical support for the further development of portable detection equipment for the element mass fraction of alloy samples.

0.   引言
  • 黄铜是由铜、锌及其它少量元素组成的合金,广泛应用在生产及生活中。黄铜中的铜、锌质量分数对合金的性能有较大影响,决定了合金材料的性质及用途。实现合金中元素质量分数的快速、精准定量分析,对合金材料的生产和应用具有重要意义。目前针对合金元素的检测方法有:分光光度法、原子吸收光谱法、电感耦合等离子体光谱法及化学滴定法等,以上方法需要对样品进行消解等前处理过程,很难实现合金中元素质量分数的快速、原位定量分析。

    激光诱导击穿光谱(laser-induced breakdown spectroscopy, LIBS)技术具有多元素同时测量、分析速度快、无需复杂的样品前处理以及原位在线检测等特点,近年来在环境[1-4]、食品[5-6]、地质[7]、工业[8-11]、海洋[12]以及太空[13-14]等领域开展了相关研究。LIBS定量分析需要通过测量标准样品来获取定标曲线,然而很多实际测量对象无法获取标准样品,研究者提出自由定标激光诱导击穿光谱(calibration-free LIBS, CF-LIBS)来对样品开展定量分析[15]。CF-LIBS定量计算的准确性受到自吸收效应及基体效应的影响。SUN等人[16]对铝合金提出内部参考线方法, 来修正自吸收效应:为每种元素选择一个内部参考线,同种元素的其它谱线与此参考线进行比较,来评估谱线的自吸收程度,最终用回归算法实现最佳的校正。DONG等人[17]对铝青铜合金采用内部参考线和迭代算法对光谱进行自吸收校正,并引入遗传算法结合标准样品来修正等离子体温度。ZHANG等人[18]选用与待测样品基质相同的标准样品,通过迭代计算来对比不同等离子体温度和谱线强度校正系数对应的元素质量分数标准误差和,以此优化等离子体温度和谱线强度校正系数。LI等人[19]提出以理想黑体辐射光谱为参照,通过直接比较钛合金等离子体光谱和黑体辐射强度来计算等离子体温度及光学系统收集效率参数,以此实现谱线光谱强度的自吸收效应校正。HU等人[20]提出采用柱密度来计算铝青铜和铝合金等离子体温度,柱密度的基础是计算每条谱线的自吸收系数,针对每种元素选择一条标准参考线,最终计算得到样品中元素质量分数。相关研究都要对谱线的自吸收进行校正,由于灵敏度低的谱线自吸收效应也相应较低,对每条谱线自吸收系数进行计算, 并通过迭代算法获取最佳的等离子体温度,整个过程计算量较大。等离子体温度和元素质量分数的计算结果与每条谱线有关,因而CF-LIBS中谱线组合的选择与计算的准确性密切相关。

    本文中采用CF-LIBS对3种黄铜样品开展定量分析,通过设置激发能量并选择低灵敏度的谱线组合,以降低自吸收效应的影响。选择铜元素的6条和锌元素的4条谱线组合作为分析对象,对比分析单次脉冲和10次脉冲平均的光谱采集方式下,铜和锌元素特征谱线的相对标准偏差(relative standard deviation, RSD)。建立铜和锌的Boltzmann平面图并计算其质量分数,与元素质量分数标准值对比,分析铜和锌元素质量分数的相对误差。

1.   实验
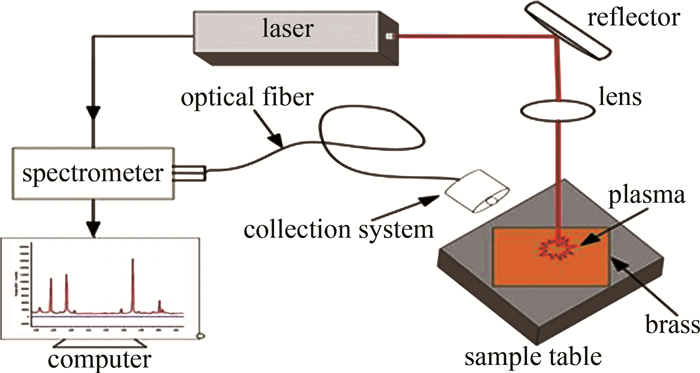
  • 采用输出波长1064 nm的Nd∶YAG脉冲激光器作为激发光源,激光能量最大300 mJ,脉冲宽度小于7 ns,脉冲重复频率设置为1 Hz。激光光束经由1064 nm全反镜反射,通过焦距为50 mm的透镜会聚后作用在黄铜样品表面(样品置于空气环境中),高功率密度的脉冲激光在黄铜表面激发出等离子体,等离子体信号经光学收集系统耦合到光纤,光谱信号通过光纤传输至光谱仪完成光谱的分光和探测,样品置于2维平台上以避免重复打点。实验系统原理图如图 1所示。

    Figure 1.  Schematic diagram of experimental system

    实验中所用样品为黄铜(H62、H80和H90),3种黄铜样品中铜和锌元素质量分数如表 1所示。

    element sample
    H62 H80 H90
    Cu 60.5~63.5 79~81 88~91
    Zn 36.5~39.5 19~21 9~12

    Table 1.  Mass fraction of Cu and Zn in brass/%

  • 在局部热平衡条件下,粒子从高能级i跃迁到低能级j的发射光谱强度为:

    式中: F为常数; T是发射粒子的温度; Iλ是波长λ处的光谱强度; Cs是样品中被测粒子的浓度; Aijij能级间自发跃迁机率; gi是能级i的简并度; kB是玻尔兹曼常数; Ei是上能级能量; Us(T)是粒子的配分函数。Us(T)可由下式表示:

    对式(1)进行变换可得:

    式中: m=-1/(kBT); qs=ln[FCs/Us(T)]; x=Ei; y=ln[Iλ/(giAij)]。

    绘制Boltzmann平面图,qs为直线截距,m为斜率。根据m可以计算温度T,并得到各个元素的配分函数Us(T),然后归一化求得F的值,最后可得各粒子的浓度,即:

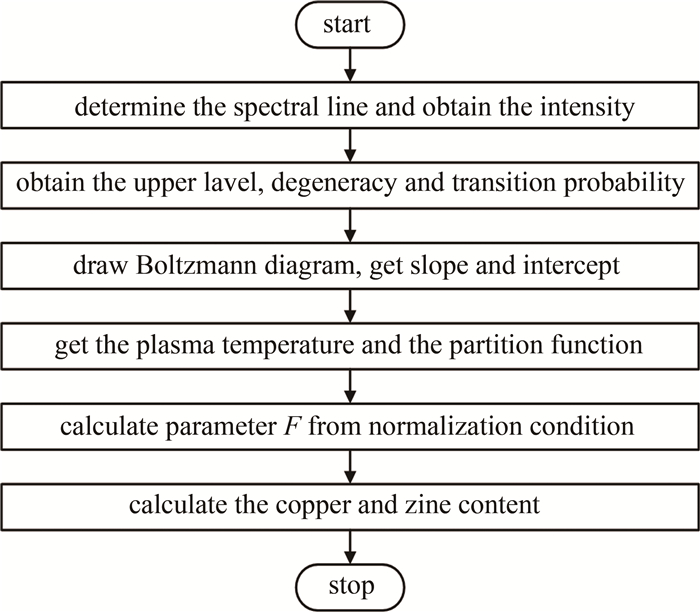
    CF-LIBS中元素的质量分数计算过程可以由图 2表示。

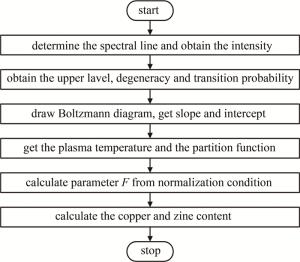
    Figure 2.  Calculation process of element mass fraction in CF-LIBS

2.   结果与讨论
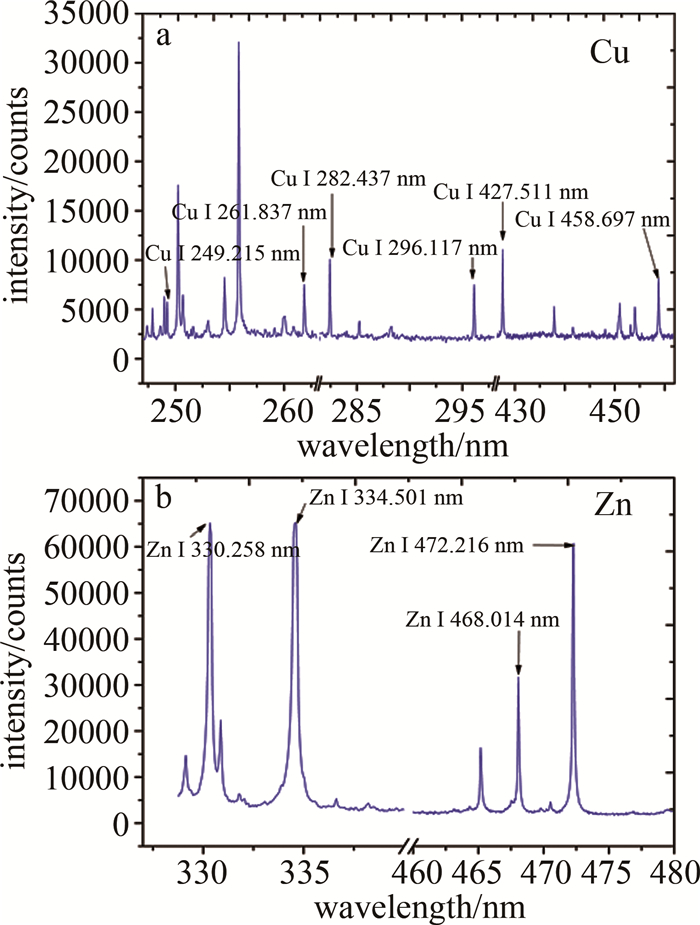
  • CF-LIBS中元素质量分数的计算结果与选择的分析谱线密切相关,黄铜样品中Cu的原子发射谱线众多,从LIBS特征谱线上能级能量的分布以及谱线灵敏度综合考虑,选择Cu分布在240 nm~460 nm波长范围内的Cu Ⅰ 249.215 nm、Cu Ⅰ 261.837 nm、Cu Ⅰ 282.437 nm、Cu Ⅰ 296.117 nm、Cu Ⅰ 427.511 nm以及Cu Ⅰ 458.697 nm等6条特征谱线以及Zn分布在330 nm~480 nm波长范围内的Zn Ⅰ 330.258 nm、Zn Ⅰ 334.501 nm、Zn Ⅰ 468.014 nm以及Zn Ⅰ 472.216 nm等4条特征谱线为分析对象。黄铜样品中铜和锌元素的LIBS光谱如图 3所示。

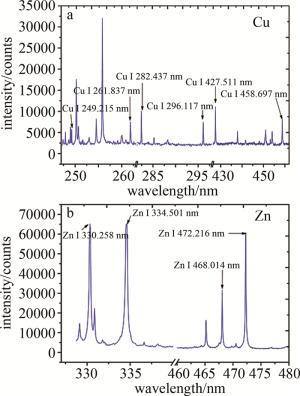
    Figure 3.  LIBS spectrum of Cu and Zn

    图 3表明, 所选择铜和锌元素的特征谱线清晰且不受周边其它谱线干扰。Cu和Zn的相关参数如表 2所示[21]

    λ/nm Ei/eV gi giAij/108 s-1
    Cu Ⅰ 249.215 4.9735 4 0.112
    Cu Ⅰ 261.837 6.1227 4 1.23
    Cu Ⅰ 282.437 5.7775 6 0.47
    Cu Ⅰ 296.117 5.5747 8 0.301
    Cu Ⅰ 427.511 7.7370 8 2.76
    Cu Ⅰ 458.697 7.8046 6 1.92
    Zn Ⅰ 330.258 7.7827 5 6
    Zn Ⅰ 334.501 7.7834 7 11.9
    Zn Ⅰ 468.014 6.6545 3 0.47
    Zn Ⅰ 472.216 6.6545 3 1.37

    Table 2.  The related parameters of Cu and Zn

  • 由于激光能量越高,特征谱线出现自吸收效应的可能性相应就越大,为了尽量降低特征谱线自吸收效应对计算结果的影响,将激光能量设置到较低水平。激光能量设置为83 mJ,光谱采集延时和门宽分别为2 μs和30 μs。在单次脉冲和10次脉冲平均两种光谱采集方式下,分别测量10组数据,对比分析铜、锌元素的光谱稳定性。Cu的6条特征谱线以及Zn的4条特征谱线光谱强度RSD对比结果如图 4所示。

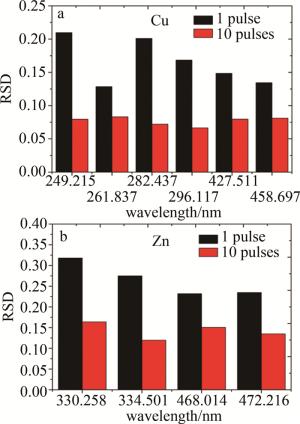
    Figure 4.  RSD of characteristic lines under two spectral acquisition modes

    图 4表明, 单次脉冲条件下,铜元素6条特征谱线和锌元素4条特征谱线的RSD平均值分别为16.5%和26.5%;10次脉冲平均条件下,铜元素6条特征谱线和锌元素4条特征谱线的RSD平均值分别为7.7%和14.2%。与单次脉冲相比,10次脉冲平均使铜和锌元素的光谱RSD平均值分别下降8.8%和12.3%。

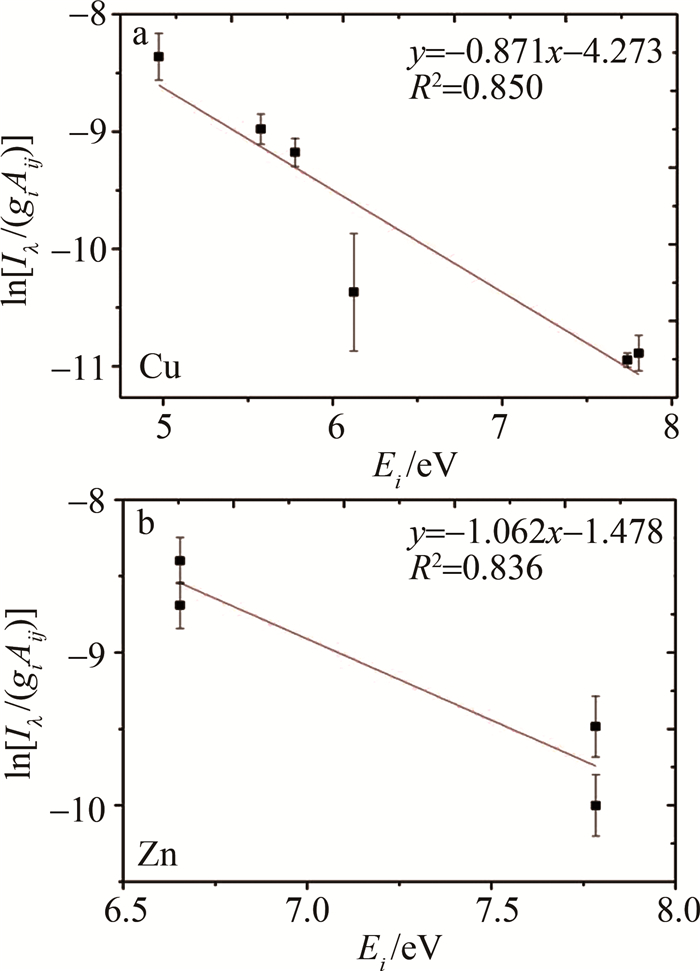
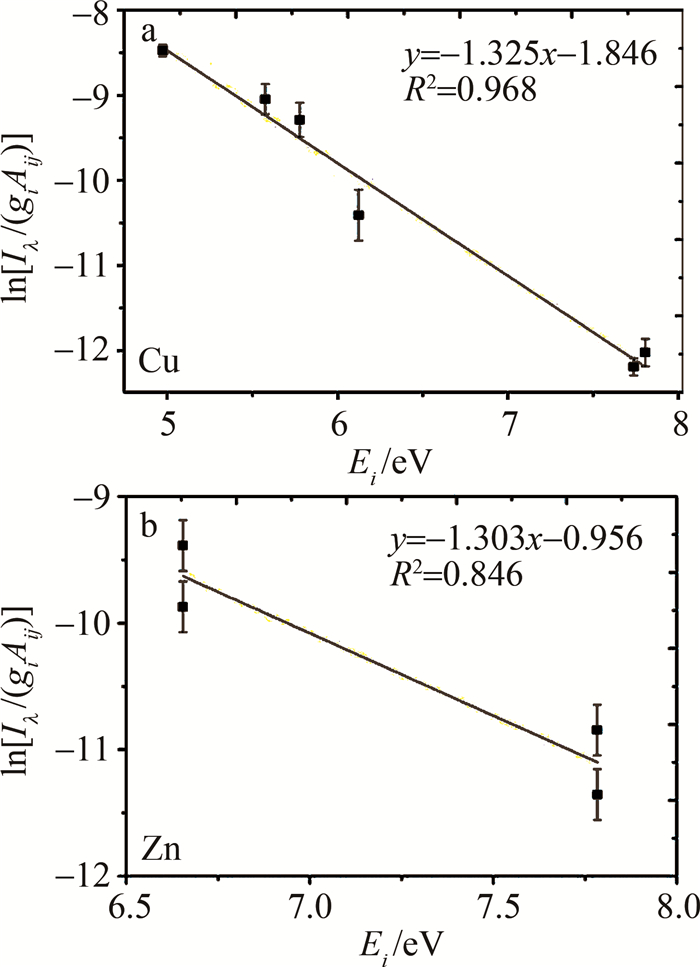
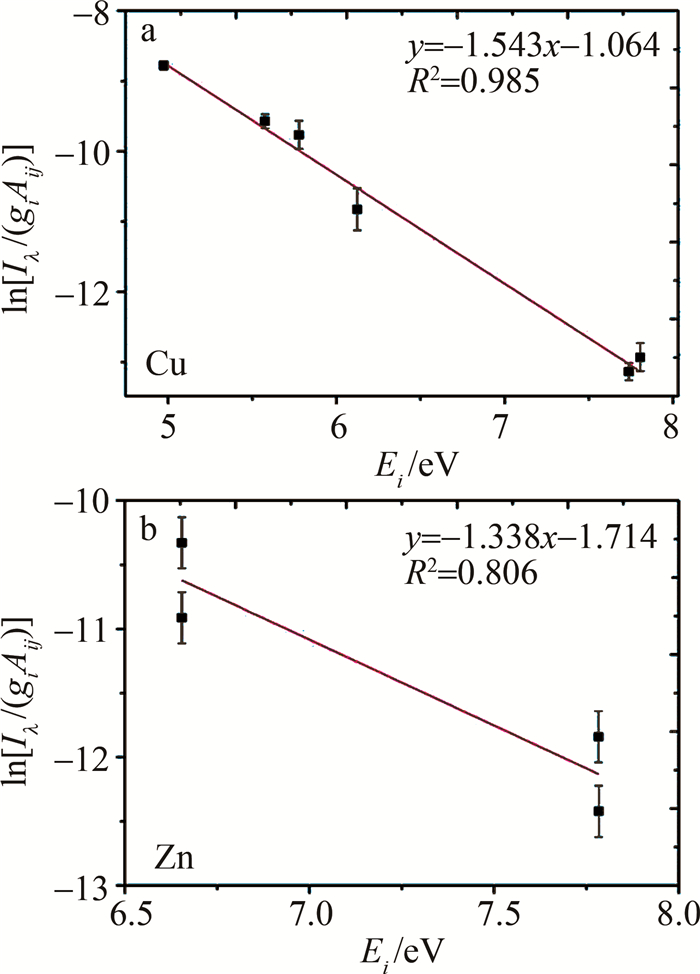
  • 每幅LIBS光谱由10次激光脉冲平均,每个黄铜样品测量10组数据,最终的光谱强度为10次测量的平均值。对3种黄铜中Cu和Zn分别建立Boltzmann平面图,具体结果如图 5~图 7所示。

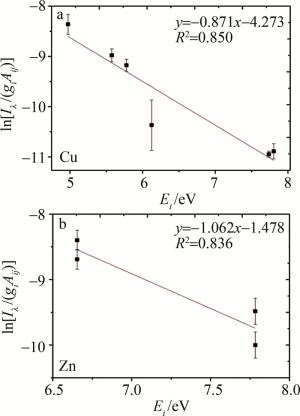
    Figure 5.  Boltzmann diagram of copper and zinc in H62

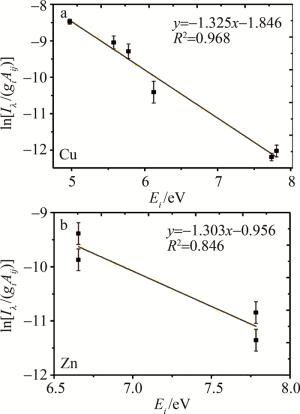
    Figure 6.  Boltzmann diagram of copper and zinc in H80

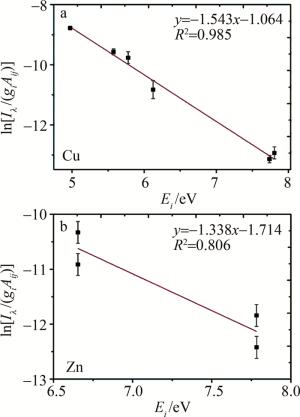
    Figure 7.  Boltzmann diagram of copper and zinc in H90

    以黄铜H62为例,由图 5a~图 5b的结果可以得到Cu和Zn对应的斜率和截距分别为:mCu=- 0.871,qs, Cu=-4.273;mZn=-1.062,qs, Zn=-1.478;分别求得铜和锌的温度为:TCu=12100 K,TZn=10900 K; 分别求出铜和锌相应的配分函数为:Us, Cu(T)=0.1895, Us, Zn(T)=0.0082。

    通过归一化条件确定F=0.00451,最终计算得到Cu和Zn的质量分数。经过上述计算可知, 黄铜H62中Cu的质量分数为58.5%,Zn的质量分数为41.5%。

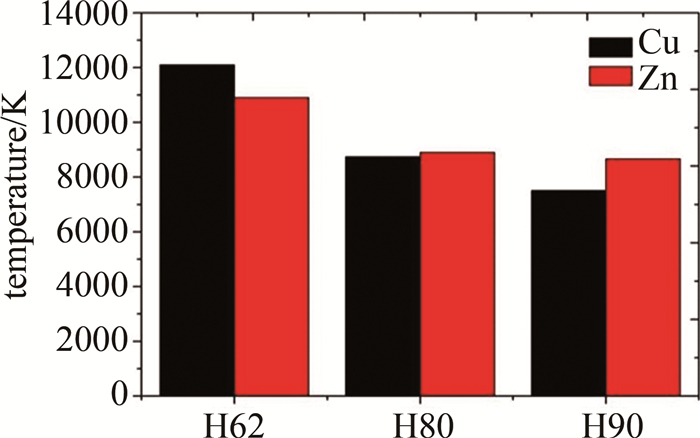
    CF-LIBS方法是基于等离子体局部热平衡假设,即等离子体内部粒子之间要达到热平衡条件。对黄铜样品中铜和锌元素等离子体温度进行分析,结果如图 8所示。

    Figure 8.  Plasma temperature of copper and zinc in three brass samples

    图 8表明, 3种黄铜样品中等离子体温度平均值分别为11500 K、8820 K和8085 K,铜和锌元素各自的温度与等离子体温度平均值之间的相对误差分别为5.2%、0.9%和7.1%,这说明3种样品中铜和锌元素等离子体温度均较为接近,符合等离子体局部热平衡假设的基本要求。

  • 将3种样品的质量分数计算值与标准值进行误差分析,3种黄铜样品中铜和锌元素的质量分数计算值和质量分数标准值如表 3所示。

    samples standard value calculated value
    Cu Zn Cu Zn
    H62 62.0 38.0 58.5 41.5
    H80 80.0 20.0 80.4 19.6
    H90 89.5 10.5 88.1 11.9

    Table 3.  Standard and calculated values of copper and zinc mass fraction in three samples/%

    表 3中质量分数标准值取表 1中元素质量分数范围的中间值,3种样品中铜和锌元素质量分数的相对误差如图 9所示。

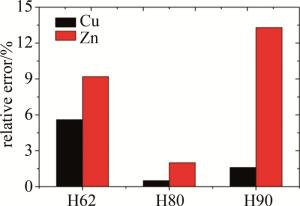
    Figure 9.  Relative error of copper and zinc mass fraction in three samples

    图 9表明,H62、H80和H90 3种样品中铜元素质量分数的相对误差分别为5.6%、0.5%和1.6%;锌元素质量分数的相对误差分别为9.2%、2.0%和13.3%。3种样品中铜和锌元素质量分数的平均相对误差分别为2.6%和8.2%。CF-LIBS方法中元素质量分数的计算误差与选择分析的每条特征谱线密切相关,特征谱线的光谱强度、上能级能量、简并度以及跃迁几率等参数会影响玻尔兹曼图的拟合结果,从而影响等离子体温度和配分函数,最终对元素质量分数的计算结果产生影响。

3.   结论
  • 采用CF-LIBS分析了3种黄铜样品中铜和锌元素质量分数,选用Cu的6条特征谱线以及Zn的4条特征谱线组合作为分析对象,铜和锌元素之间的温度均较为接近,与等离子体温度平均值的最小相对误差为0.9%;铜和锌元素质量分数的最小相对误差分别为0.5%和2.0%,平均相对误差分别为2.6%和8.2%,获得了较好的计算结果。以上研究结果有望为进一步研制合金元素质量分数便携式检测设备提供数据和技术支持。

Reference (21)

Catalog

    /

    DownLoad:  Full-Size Img  PowerPoint
    Return
    Return