 Map
Map


HTML
-
糖尿病是源于人体内胰岛素异常而引发的疾病,通常会导致中风、肾衰竭、心脏病等一系列并发症[1]。根据相关部门统计,每年约有1/3~1/2的糖尿病患者不能及时确诊[2]。早期进行及时检测,可以很大程度减少并发症的产生[3]。因此,糖尿病筛查起着至关重要的作用。目前糖尿病高危人群初步筛查主要以空腹血糖[4]、口服葡萄糖耐量试验(oral glucose tolerance test,OGTT)[5]、随机血糖[6]、糖化血红蛋白[7-8]等为主,不过这些方法皆为有创的检测手段,对人体存在诸多不利的影响。此外,还有以风险评估问卷调查[4]为主的无创筛查方法,通过年龄、体质指数、腰围、体重、血压[9]等指标预测结果,达到筛查的目的。但该方法缺少血糖监测,会一定程度上造成判别结果的不准确。基于光学的无创糖尿病筛查方法,主要以皮肤荧光光谱法为主。EDIGER等人[10]通过荧光光谱法测量了2793名患者晚期糖基化终末产物,并与空腹血糖和糖化血红蛋白进行对比,结果表明,皮肤荧光技术在检测异常糖耐量方面比空腹血糖或糖化血红蛋白更敏感。PAOLILLO等人[11]研究了皮肤自身荧光以及皮肤糖化蛋白与健康和不健康受试者的临床特征之间的关系,在104名患有或不患有糖尿病和中风的20~80岁的受试者进行研究,结果表明,患有胰岛素抵抗、糖尿病和中风患者的皮肤自体荧光水平升高,皮肤自发荧光与年龄体重指数、体脂、腰围和收缩压之间呈正相关;同时也表明在检测晚期糖基化终末产物时,受皮肤差异、测量位置及接触压力等多种因素影响。
相比于上述光学无创检测手段,光学相干层析成像(optical coherence tomography,OCT)是一种可达到微米量级的高分辨率成像技术,具有非接触、无创伤等优点[12-13]。OCT检测血糖的优势在于能够找到真皮层内部散射系数与血糖变化相关性最高的组织区域进行计算,从而实现无创血糖的精确检测。MIURA等人[14]通过更换10×、5×、3×不同倍率物镜,对球形聚苯乙烯颗粒悬浮液开展实验,结果表明, 低倍率物镜有助于提高葡萄糖测量的准确性。PODDAR等人[15]通过有效近似的蒙特卡罗模拟,表明了葡萄糖浓度与降低OCT测量组织的散射系数之间存在相关性。ESENALIEV等人[16]通过对无毛尤卡坦微猪和新西兰兔进行了葡萄糖注射实验,表明血糖浓度从4 mmol/L增加到30 mmol/L,OCT信号的斜率显著下降40%,并呈现线性关系,散射系数测量的精度可达1%。LAN等人[17]通过OCT检测健康志愿者与糖尿病患者的血糖浓度,表明糖尿病患者血糖浓度与OCT信号斜率的相关系数为0.91,与健康志愿者的相关系数为0.78。LARIN等人[18]通过对健康志愿者进行标准口服葡萄糖耐量试验,表明OCT可以测量特定组织层的OCT信号,而排除其它组织层不需要的OCT信号。此外,该课题组还研究了OCT技术对无创血糖检测的特异性,结果表明, KCl、NaCl和尿素3种体渗透液可以改变组织液与散射中心之间的折射率不匹配,但葡萄糖的影响大约高1~2个数量级[19]。ZHOU等人[20]发现在图像采集过程中,光学探头与被测皮肤的相对位置变化会导致OCT图像发生偏移, 从而提出了一种图像校正补偿方法,将血糖检测的准确度提高了36.57%。但目前基于OCT的无创血糖检测技术仍存在一些不足之处,例如首先需要通过采集指尖血进行标定[21],计算得到血糖敏感区域后,才可无创检测人体血糖的变化情况。
基于上述问题,本文作者提出了一种基于光学相干层析的高危人群糖尿病初步筛查的方法,其优势在于不需要采集指尖血进行检测。主要是根据健康、轻度糖尿病、重度糖尿病人群在0 h~2 h的血糖归一化经验值,得到判定阈值,而后通过主成分分析获取与血糖信息相关的OCT散射系数相对变化量,并与阈值进行比较,实现对高危人群进行糖尿病初步筛查的目的。
-
实验中所使用仪器为高速扫频OCT,中心波长为1310 nm,轴向分辨率为5.8 μm,横向分辨率为9.7 μm,最大成像范围(X×Y×Z)为5 mm×5 mm×6 mm,图像采集大小为3 mm×3 mm×6 mm,A-Scan扫描频率为100 kHz,平均功率为10 mW。
-
实验对象为5名健康志愿者以及3名糖尿病志愿者。每名健康志愿者采用口服葡萄糖耐量实验,实验前空腹10 h以上,实验开始将75 g葡萄糖溶于250 mL水中,2 min中内饮用完毕。每名糖尿病志愿者正常用餐,并于餐前注射胰岛素。为了验证本文中糖尿病筛查方法的准确性,在OCT仪器采集数据的同时,同步测量被测试者的血糖值作为对照。健康志愿者使用泰尔茂血糖仪,测量指尖血糖值作为标准血糖值,糖尿病志愿者佩戴雅培瞬感血糖仪,测量组织间隙液血糖值作为标准血糖值。
实验前用酒精擦拭手臂内侧,使皮肤表面清洁,被测试区域贴上定位标签,并戴上腕带探头进行检测[22]。实验时长为2 h左右,OCT 3维图像的采集时间间隔为1 min。健康志愿者10 min~15 min采集一次指尖血(根据血糖变化快慢做出适当调整)。糖尿病志愿者使用雅培瞬感血糖仪,每隔1 min获得一个血糖值。
1.1. 实验仪器及参数
1.2. 实验方法
-
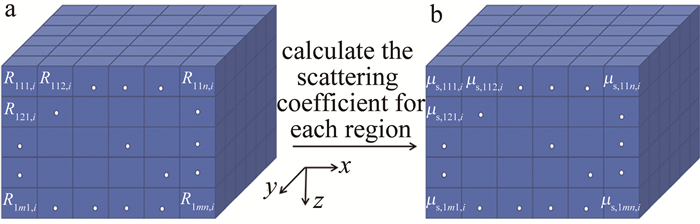
通过OCT采集手臂皮肤图像,可获取{t1, t2, …, ti, …, tw}(1≤i≤w, w≥120)不同时刻的3-D OCT图像。由于真皮层区域含有较丰富的毛细血管及组织间液,其区域内组织散射系数与血糖变化具有良好的相关性。因此,主要选取皮肤表面以下250 μm~750 μm的真皮层区域用于计算。首先将该区域(x×y×z)按200 μm×200 μm×100 μm进行划分,得到所有小块区域的集合为{R111, i, R112,i, …, Rpmn,i},如图 1a所示。其次,求取每一小块区域对应的散射系数{μs,111,i, μs,112, i, …, μs, pmn, i},如图 1b所示。
Figure 1. a—3-D OCT image region segmentation b—calculation of scattering coefficient for each region
散射系数基于比尔-朗伯定律计算得到[23]:
式中: z为选取计算皮肤区域的深度; I0为入射光强; I为通过样品后的光强; μt为光衰减系数。通常在近红外光谱范围内,生物组织的散射系数要远大于吸收系数[23]。因此,依据比尔-朗伯定律计算得到的光衰减系数可近似看作散射系数。按照上述方法逐个计算每一小块区域的散射系数,对应时刻的散射系数排列成1维。不同时刻按照相同的方法进行划分、排列,最终计算得到所有划分区域的散射系数,如表 1所示。
time/min scattering coefficient of region R111/mm-1 scattering coefficient of region R112/mm-1 … scattering coefficient of region Rpmn/mm-1 t1 μs, 111, 1 μs, 112, 1 … μs, pmn, 1 t2 μs, 111, 2 μs, 112, 2 … μs, pmn, 2 ti μs, 111, i μs, 112, i … μs, pmn, i tw μs, 111, w μs, 112, w … μs, pmn, w Table 1. Database of scattering coefficient
-
主成分分析(principal component analysis,PCA)[24]是将原来众多具有相关性的指标转化为少数几个相互独立的综合指标的一种统计方法,因此,可利用此方法将所有血糖敏感区域的散射系数变化转变为一个综合指标,血糖不敏感区域散射系数变化转变为另外的一个或多个综合指标,这也是将3维OCT图像划分为众多小块区域的原因所在。具体方法步骤见下。
经过上述数据获取方法,可获得2维数据矩阵D:
(a) 将数据D中心化为D′:
式中: $\overline{\mu_{\mathrm{s}, j}}=\left(\mu_{\mathrm{s}, j, 1}+\mu_{\mathrm{s}, j, 2}+\cdots+\mu_{\mathrm{s}, j, \mathrm{i}}\right) / w; j=111, 112, \cdots, pmn$。
(b) 对D′求特征协方差矩阵C:
式中: T表示转置。
(c) 求协方差矩阵C的特征值和特征向量,令|C-λE|=0,E为p×m×n的单位矩阵,经计算得到的λ为特征值,按照从大到小的顺序排序为λ1, λ2, …, λpmn。根据特征值求取对应的特征向量P1, P2, …, Ppmn。
(d) 选择第二特征值对应的特征向量P2,并将散射系数投影到第二特征向量上为主成分Z。在这里选择第二特征值原因为:经过近30组实验,发现90%左右将散射系数投影到第二特征向量上与血糖变化高度相关。
(e) 将主成分Z进行归一化,归一化至0~1区间,归一化后的结果为归一化主成分Zn,其在0 h~2 h内每隔1 min的数值为Si(i=0, 1, 2, …, 120),2 h时刻的数值为S120。
式中:Zmin为Z的最小值; Zmax为Z的最大值。
-
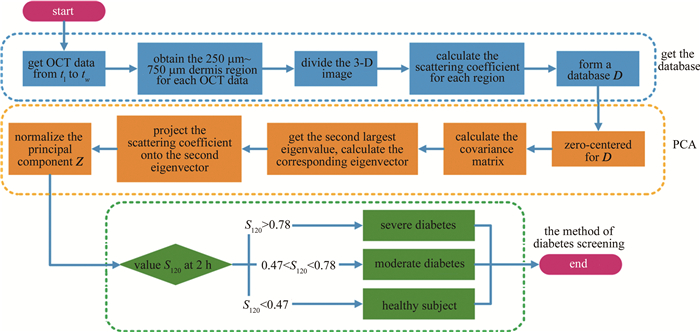
综合参考文献[25]~[30]中以及54名志愿者(26名健康志愿者,13名轻度糖尿病以及15名重度糖尿病)的临床实验数据,得出OGTT实验中健康志愿者、轻度糖尿病以及重度糖尿病的0 h~2 h血糖值的变化区间及其在2 h时刻的归一化数据,如表 2所示。健康人群在2 h时刻血糖值范围为(6.55±0.84) mmol/L,将其0 h~2 h的血糖数据归一化后,对应2 h时刻的值为0.34±0.17。轻度糖尿病2 h时刻血糖值范围为(10.09±1.80) mmol/L,对应的归一化相对量为0.64±0.22。重度糖尿病2 h时刻血糖值范围为(14.74±2.70) mmol/L,对应的归一化相对量为0.88±0.17。根据3类人群在2 h时刻归一化相对量的正态分布曲线,设置3条曲线的两两交点位置为阈值,分别为0.47与0.78。即若归一化主成分在2 h时刻的数值S120落在[0, 0.47)区间内判为健康,[0.47, 0.78)区间内为轻度糖尿病,[0.78, 1]区间内为重度糖尿病。不过,目前所依据的临床实验数据,其对应的志愿者在年龄、性别等方面均有差异。此外,血糖值获取也分为静脉血糖值和指尖血糖值。随着实验数据的累积,后续可以对不同人群进行细化分类或者通过大数据分析计算得到更准确的评判阈值。糖尿病筛查方法流程如图 2所示。
blood glucose change of 0 h/(mmol·L-1) blood glucose change of 0.5 h/(mmol·L-1) blood glucose change of 1 h/(mmol·L-1) blood glucose change of 2 h/(mmol·L-1) mean±standard deviation blood glucose change of 2 h/(mmo·L-1) mean±standard deviation blood glucose change of 2 h of S120 healthy subject 5.12 8.31 9.31 6.55 6.55±0.84 0.34±0.17 moderate diabetes 5.86 9.99 12.51 10.09 10.09±1.80 0.64±0.22 severe diabetes 7.60 12.91 15.71 14.76 14.76±2.70 0.88±0.17 Table 2. Blood glucose change data at different time of healthy subject, moderate diabetes and severe diabetes

Figure 2. Flow chart of diabetes screening method
2.1. 图像数据处理
2.2. 主成分分析
2.3. 高危人群的糖尿病筛查
-
所有8名志愿者的归一化主成分Zn与标准血糖值相关系数以及判别结果如表 3所示。classification为已知的健康或者糖尿病志愿者,correlation coefficient为归一化主成分Zn与标准血糖值的整体相关性系数,S120为归一化主成分Zn在2 h时刻的相对值,G120为血糖仪检测的2 h时刻的归一化相对值,与S120作为对照, discrimination为通过S120与阈值进行比较,判别为健康、轻度糖尿病或重度糖尿病的筛查结果。由表 3可以看出,8名志愿者归一化主成分Zn与血糖值变化曲线均具有较高的相关系数,且平均相关系数达到了0.86,这表明归一化主成分Zn能够正确地反映血糖的变化趋势,也说明了使用主成分分析法能够准确地提取出散射系数对血糖变化敏感的区域。经过糖尿病筛查方法判定,8名志愿者均得到了正确的筛查结果。图 3展示了其中4位志愿者的数据。
volunteers classification correlation coefficient S120 G120 discrimination volunteer 1 health 0.84 0.03(< 0.47) 0(< 0.47) healthy subject volunteer 2 health 0.92 0.33(< 0.47) 0.38(< 0.47) healthy subject volunteer 3 diabetes 0.89 (0.47 < )0.73(< 0.78) (0.47 < )0.75(< 0.78) moderate diabetes volunteer 4 diabetes 0.93 0.98(>0.78) 0.96(>0.78) severe diabetes volunteer 5 health 0.94 0.24(< 0.47) 0.46(< 0.47) healthy subject volunteer 6 health 0.96 0.10(< 0.47) 0.18(< 0.47) healthy subject volunteer 7 health 0.70 0(< 0.47) 0.33(< 0.47) healthy subject volunteer 8 diabetes 0.73 (0.47 < )0.58(< 0.78) (0.47 < )0.75(< 0.78) moderate diabetes mean — 0.86 — — — Table 3. Screening results of 8 volunteers
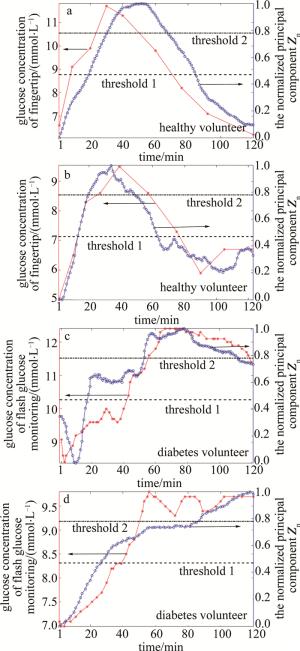
Figure 3. Comparison of blood glucose values and the normalized principal components Zn in healthy and diabetes subjects

-
提出了一种基于OCT的针对高危人群糖尿病无创筛查方法,通过此方法获取的归一化主成分Zn与标准血糖值相关性可达0.86,并通过设置阈值1为0.47,阈值2为0.78,将归一化主成分Zn 2 h时刻的数值S120位于[0, 0.47)区间内判为健康,位于[0.47, 0.78)区间内判为轻度糖尿病,位于[0.78, 1]区间内判为重度糖尿病。通过8名志愿者临床血糖实验进行了验证,均得到了准确的筛查结果。此方法属于光学无创糖尿病筛查方法,其优势为无需使用血糖值做前期标定,极大地简化了检测流程。该方法对于光学无创血糖检测以及高危人群的糖尿病初步筛查均具有重要的应用参考价值。
 DownLoad: