Advanced Search

ISSN1001-3806 CN51-1125/TN Map

Volume 43 Issue 3
Mar.  2019
Article Contents
Turn off MathJax

Citation:

Analysis of SO2 and NO2 concentration profiles in Huainan detected by a lidar

  • Corresponding author: HU Shunxing, sxhu@aiofm.ac.cn
  • Received Date: 2018-07-23
    Accepted Date: 2018-08-27
  • In order to preliminarily explore the spatial and temporal distribution characteristics of SO2 and NO2 in the atmosphere of Huainan area, one self-developed differential absorption lidar system was used to measure the distribution profiles of SO2 and NO2 concentrations in the atmosphere of a certain Huainan area in some months. The typical examples were selected and the distribution characteristics of SO2 and NO2 were analyzed from three aspects of diurnal variation of horizontal concentration, variation of vertical concentration and monthly variation of horizontal concentration of gases. The results show that, the concentration of SO2 and NO2 at night on the same day was higher than that at afternoon. The vertical concentration of SO2 and NO2 decreased with the increase of altitude. The monthly variation of horizontal concentration of SO2 and NO2 gas is the highest in winter and the lowest in summer, the second in spring and autumn months. The variation of SO2 and NO2 concentration is the result of the interaction of population activities and meteorological conditions.
  • 加载中
  • [1]

    LIU Q. Environmental chemistry[M]. Beijing:Chemical Industry Press, 2006:103-116(in Chinese).
    [2]

    TANG X Y, ZHANG Y H, SHAO M, et al. Atmospheric environmental chemistry[M].2nd ed.Beijing:Higher Education Press, 2006:40-44(in Chinese).
    [3]

    YAN P, LI X Sh, LUO Ch, et al. Observational analysis of surface O3, NOx and SO2 in China[J].Quarterly Journal of Applied Meteo-rology, 1997, 8(1):53-61(in Chinese).
    [4]

    CHATTERTON T, DORLING S, LOVETT A, et al. Air quality in Norwich, UK multi-scale modelling to assess the significance of city, county and regional pollution sources[M]. Urban Air Quality: Mea-surement, Modelling and Management. Springer Netherlands, 2000, 15(3): 425-433.
    [5]

    MENG Y J, CHENG C L. Impact of surface synoptic situations on air pollution in Beijing area[J]. Meteor Mon, 2001, 28(4):42-46(in Chinese).
    [6]

    WEI Y X, TONG Y Q, YIN Y, et al. The variety of main air pollutants concentration and its relationship with meteorological condition in Nanjing city[J]. Transactions of Atmospheric Sciences, 2009, 32(3):451-457(in Chinese).
    [7]

    HUANG J, HU Sh X, CAO K F, et al. Design of three dimensional scanning control system for air pollution monitoring Lidar based on LabVIEW[J]. Journal of Atmospheric and Environmental Optics, 2013, 8(2):124-129(in Chinese).
    [8]

    LIN J M, CAO K F, HU Sh X, et al. The experiment study of SO2 measurement by differential absorption Lidar[J]. Infrared and Laser Engineering, 2015, 44(3):872-879(in Chinese).
    [9]

    LIU Q W, WANG X B, CHEN Y F, et al. Detection of atmospheric NO2 concentration by differential absorption Lidar based on dye lasers[J]. Acta Optica Sinica, 2017, 37(4):428004(in Chinese).
    [10]

    WEITKAMP C. Lidar range resolved optical remote sensing of the atmosphere[M]. New York: Springer-Verlag New York Inc., 2005: 187-209.
    [11]

    LIU X H, HONG Zh X, LI J L, et al. Meteorological and chemical parameters determining the photochemical air pollution in Beijing[J]. Climatic and Environmental Research, 1999, 4(3):231-236(in Chinese).
    [12]

    YIN D Zh, HONG Zh X. Study on the boundary layer structure and parameters under heavy pollution conditions in Beijing[J]. Climatic and Environmental Research, 1999, 4(3):303-307(in Chinese).
    [13]

    MA Zh Q, WANG Y S, SUN Y, et al. Characteristics of vertical air pollutants in Beijing[J]. Research of Environmental Sciences, 2007, 20(5):1-6(in Chinese).
    [14]

    CA G L, ZHANG X Y, GONG S L, et al. Emission inventories of primary particles and pollutant gases for China[J]. Chinese Science Bulletin, 2011, 56(8):781-788. doi: 10.1007/s11434-011-4373-7
    [15]

    STRETS D G, BOND T C, CARMICHAEL G R, et al. An inventory of gaseous and primary aerosol emissions in Asia in the year 2000[J]. Journal of Geophysical Research Atmospheres, 2003, 108(D21):GTE30-1.
    [16]

    HE J J, WU L, MAO H J, et al. Impacts of meteorological conditions on air quality in urban Langfang, Hebei Province[J]. Research of Environmental Sciences, 2016, 29(6):791-799(in Ch-inese).
    [17]

    ZHANG L, LIAO H, LI J P. Impacts of Asian summer monsoon on seasonal and interannual variations of aerosols over eastern China[J]. Journal of Geophysical Research Atmospheres, 2010, 115(7):2232-2232.
    [18]

    WANG Zh B, FANG Ch L, XU G, et al. Spatial-temporal characteristics of the PM2.5 in 2014[J]. Acta Geographica Sinica, 2015, 70(11):1720-1734(in Chinese).
  • 加载中
通讯作者: 陈斌, bchen63@163.com
  • 1. 

    沈阳化工大学材料科学与工程学院 沈阳 110142

  1. 本站搜索
  2. 百度学术搜索
  3. 万方数据库搜索
  4. CNKI搜索

Figures(6)

Article views(5721) PDF downloads(24) Cited by()

Proportional views

Analysis of SO2 and NO2 concentration profiles in Huainan detected by a lidar

    Corresponding author: HU Shunxing, sxhu@aiofm.ac.cn
  • 1. Key Laboratory of Atmospheric Optics, Anhui Institute of Optics and Fine Mechanics, Chinese Academy of Sciences, Hefei 230031, China
  • 2. University of Science and Technology of China, Hefei 230026, China
  • 3. Research Center for Laser Physics and Technology, Technical Institute of Physics and Chemistry, Chinese Academy of Sciences, Beijing 100190, China

Abstract: In order to preliminarily explore the spatial and temporal distribution characteristics of SO2 and NO2 in the atmosphere of Huainan area, one self-developed differential absorption lidar system was used to measure the distribution profiles of SO2 and NO2 concentrations in the atmosphere of a certain Huainan area in some months. The typical examples were selected and the distribution characteristics of SO2 and NO2 were analyzed from three aspects of diurnal variation of horizontal concentration, variation of vertical concentration and monthly variation of horizontal concentration of gases. The results show that, the concentration of SO2 and NO2 at night on the same day was higher than that at afternoon. The vertical concentration of SO2 and NO2 decreased with the increase of altitude. The monthly variation of horizontal concentration of SO2 and NO2 gas is the highest in winter and the lowest in summer, the second in spring and autumn months. The variation of SO2 and NO2 concentration is the result of the interaction of population activities and meteorological conditions.

引言
  • 二氧化硫(SO2)和二氧化氮(NO2)是大气中常见的两种污染痕量气体。SO2的产生来源主要包括人为排放以及自然释放两个方面,即化石燃料、矿物质的燃烧以及火山喷发等。NO2的来源主要包括煤炭等燃料的燃烧、汽车尾气以及化工厂气体的排放等。这两种气体对环境、人体以及动植物的危害较大,它们参与酸雨以及光化学烟雾的形成,同时人体吸入这两种污染气体可造成呼吸器官的损伤[1-2]。鉴于上述危害,各国政府对SO2及NO2的排放检测尤为重视。

    目前国内外对SO2及NO2分布特征及其浓度影响因素进行了研究。YAN等人[3]研究发现SO2及NO2浓度具有显著的日变化和季节变化特征。CHATTERTON等人[4]得出城市大气环境与人群活动密切相关的结论。MENG等人[5]指出SO2及NO2浓度受不同气象条件影响严重。WEI等人[6]等发现SO2及NO2浓度与风速、降水等气象因素有关。监测SO2及NO2浓度分布的方法较多,其中差分吸收激光雷达(differential absorption lidar, DIAL)因具有测量范围大、时空分辨率高、快速实时等优点受到广泛重视。

    本文中利用中国科学院安徽光学精密机械研究所自2012年研发的差分吸收激光雷达系统[7-9]在淮南市大气科学研究院进行SO2及NO2气体探测,根据其探测结果分析这两种气体水平浓度日变化、垂直浓度变化以及水平浓度月变化的特征及其影响浓度分布特征的因素,初步探究淮南地区大气SO2及NO2的不同时空分布特征。

1.   差分吸收激光雷达探测SO2和NO2原理
  • 差分吸收激光雷达是利用待测气体对不同波长激光吸收特性的差异来进行气体浓度测量的一种实验装置。差分吸收激光雷达向大气中发射两束激光脉冲,其中一束激光脉冲波长位于待测气体吸收峰,记为λon,另一束激光脉冲波长位于待测气体吸收谷,记为λoffλonλoff数值接近,有效消除回波信号中其它干扰气体以及气溶胶的影响,可近似认为回波信号的差异只是由待测气体的吸收特性不同所导致。

    在距离z处待测气体分子的数密度N(z)可表示为[10]

    式中,σ(λon)为待测气体分子在波长为λon的消光截面(cm2),σ(λoff)为待测气体分子在波长为λoff的消光截面(cm2),P(λon, z)是波长为λon的激光脉冲在距离z处的回波信号的强度(W),P(λoff, z)是波长为λoff的激光脉冲在距离z处的回波信号的强度(W),B, EaEm分别为大气后向散射作用项、大气气溶胶消光作用项以及空气分子消光作用项。

    因为λonλoff, 所以B, EaEm这3项误差作用项可忽略不计,则(1)式可简化为:

    在实际计算情况下,考虑到差分吸收激光雷达所测得的回波信号为离散信号,因此取一段差分距离Δz进行积分计算,则(2)式转变为如下形式:

    将原始回波数据扣除背景噪声以及降噪处理后,利用(3)式进行反演计算,将得出的结果作近一步平滑处理,可得出待测气体在探测路径上的最终浓度廓线分布结果。

    本文中采用中国科学院安徽光学精密机械研究所研制的差分吸收激光雷达系统探测,其基本结构图如图 1所示。该系统的硬件构造主要包括激光脉冲束的发射单元、回波信号接收单元以及信号采集单元。利用两台Nd:YAG固体激光器抽运4台染料激光器,经二阶谐波产生(second-harmonic generation, SHG)可产生测量SO2浓度分布所需的λ1, on=300.05nm, λ1, off=301.5nm两束激光脉冲和测量NO2浓度分布所需的λ1, on=448.1nm, λ1, off=446.6nm的两束激光脉冲,回波信号由接收单元收集,采集单元存储。系统空间分辨率为15m,激光脉冲频率为10Hz,时间分辨率为1min。

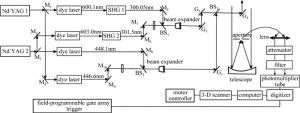
    Figure 1.  Block diagram of DIAL system

2.   淮南地区大气SO2和NO2质量浓度变化特征
  • 淮南市位于东经116°21′5″~117°12′30″,北纬31°54′8″~33°00′26″之间,属于典型的亚热带湿润季风气候。本文中选取测量结果中的典型实例从气体水平质量浓度日变化、垂直质量浓度变化和水平质量浓度月变化3个方面分析SO2和NO2不同时空尺度的质量浓度变化特征。

  • 根据2016-07-05和2017-01-12下午及夜晚时刻SO2水平浓度分布平均廓线以及2016-07-03和2017-06-08下午及夜晚时刻NO2水平浓度分布平均廓线,本文中对其进行浓度变化分析,具体分布趋势如图 2图 3所示。

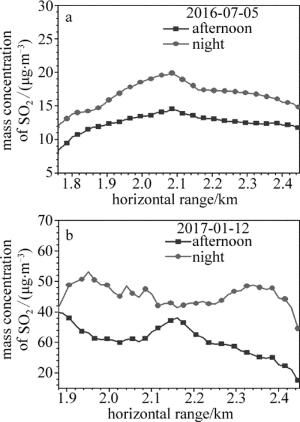
    Figure 2.  Daily changes of SO2 concentration

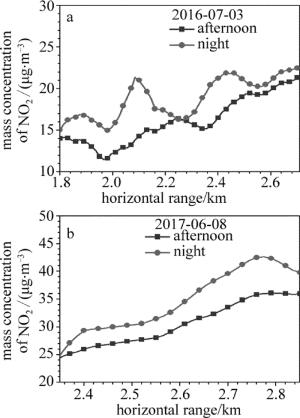
    Figure 3.  Daily changes of NO2 concentration

    图 2图 3均表现出一个明显的特征:同一天夜晚时刻SO2及NO2气体质量浓度大于下午时刻SO2及NO2气体质量浓度。其中,2016-07-05下午及夜晚,SO2质量浓度均值分别为12.50μg/m3,16.66μg/m3,2017-01-12,SO2下午及夜晚质量浓度均值分别为31.22μg/m3,45.23μg/m3;2016-07-03下午及夜晚,NO2质量浓度均值分别为22.07μg/m3,27.62μg/m3;2017-06-08下午及夜晚,NO2质量浓度均值分别为30.03μg/m3,33.81μg/m3。根据当地环保监测站点播报的SO2及NO2质量浓度值,可得出上述各天下午及夜晚时间段的浓度均值。其中,2016-07-05下午及夜晚,SO2质量浓度均值分别为13.00μg/m3,17.00μg/m3;2017-01-12下午及夜晚,SO2质量浓度均值分别为27.00μg/m3,39.00μg/m3;2016-07-03下午及夜晚,NO2质量浓度均值分别为18.00μg/m3,22.00μg/m3;2017-06-08下午及夜晚,NO2质量浓度均值分别为28.00μg/m3,34.00μg/m3。以上各天夜晚时刻SO2及NO2质量浓度均值大于下午时刻SO2及NO2质量浓度均值。利用激光雷达所测得的气体浓度值与当地环保监测站点播报的浓度值具有可比性。人群活动及相关气象因素共同作用导致SO2及NO2同一天夜晚时刻浓度大于下午时刻浓度。

    (1) 人群活动的影响。一般而言,人群活动强度有明显的昼夜差异且夜晚活动强度小于昼间活动强度。傍晚时分,下班高峰期的汽车尾气排放,居民回家烧水、做饭等人群活动使得SO2及NO2气体浓度较下午时分增加,气体累积到夜晚时分浓度呈现高值,因此, SO2及NO2夜晚时刻浓度大于下午时刻浓度。

    (2) 贴地逆温的影响。夜晚时分,地面因有效辐射增强使得近地面层降温明显,而高处大气层降温缓慢,从而出现上暖下冷的逆温现象。它就像“顶盖”一样抑制竖直方向上的气体扩散,使得贴地面层气体累积,气体浓度增加。日出之后,地表温度升高,贴地逆温逐渐消失,垂直对流作用加强,有利于气体扩散,气体浓度下降。

    (3) 大气稳定度的影响。夜晚时分,稳定的大气层结抑制空气的对流运动,湍流混合作用弱,同时,由于夜间贴地逆温的作用,气体扩散稀释作用减弱,极易造成SO2及NO2在低空堆积,气体浓度升高。下午时分,大气层结由于白天日出之后不断回升的气温以及逐渐增强的太阳辐射趋于不稳定,空气在垂直方向上的对流作用加强,湍流混合作用强,同时逆温作用随着日出地表温度升高也会逐渐消失,SO2及NO2气体扩散稀释作用增强,气体浓度降低。

  • 根据2016-11-05和2017-04-14 SO2垂直浓度分布平均廓线以及2017-01-13和2017-04-14 NO2垂直浓度分布平均廓线,本文中对其进行浓度变化分析,具体分布趋势如图 4所示。

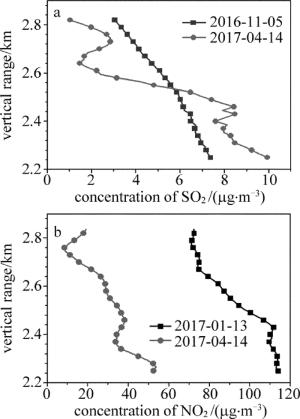
    Figure 4.  Vertical concentration distributions of SO2 and NO2

    图 4表现出一个明显的特征:随着高度的增加,SO2和NO2气体质量浓度呈递减趋势。其中,2017-04-14,测量点风向风力为南风3级~4级转西南风不大于3级,测量点南边为工厂,受大气输运影响,工厂排放的SO2及NO2经过测量点,使得气体质量浓度廓线随高度增加呈递减趋势的情况下出现浓度值增大的抖动。以上各天选取夜晚时间段的气体质量浓度垂直分布,因此各天污染源与人群活动变化无关,可认为其基本不变。相关研究表明,在污染源基本不变的情况下,气体质量浓度分布与气象条件变化关系显著[11]

    (1) 风速的影响。气体的扩散与稀释受大气运动的影响甚为明显。风速大小和湍流作用是其中两个重要影响因素。气体随风扩散到大气中不同位置,扩散的气体随着湍流作用不断与周围空气进行混合稀释,气体质量浓度降低。因此,风速大小对气体质量浓度的变化有着至关重要的影响[12-13]。高度越高,风速越大,气体扩散稀释作用越强,气体质量浓度越低,随着高度的降低,风速逐步变小,气体的扩散稀释作用得到抑制,从而造成气体累积,浓度增加。

    (2) 气压的影响。气压对气体质量浓度影响较大,主要表现为:当地面受低压控制时,四周高压气团流向中心,中心空气作上升运动,非常有利于气体向上扩散,此时天气大多表现为多云。而在晴朗天气下,地面一般受高压控制,中心部位的空气向周围下降,易造成气体下沉、累积,不利于气体扩散。2016-11-05,2017-01-13和2017-04-14均为晴朗天气,在地面高压的作用下,使得空气下沉,高度较低的位置气体浓度大,高度较高的位置气体质量浓度小。

  • 依据中国科学院安徽光学精密机械研究所差分吸收激光雷达在淮南地区2016年~2017年所测数据,可得出SO2及NO2气体水平浓度月均值。其中,因天气等原因,未测满12个月的数据,将所测结果按时间顺序绘制柱状图,具体变化趋势如图 5图 6所示。

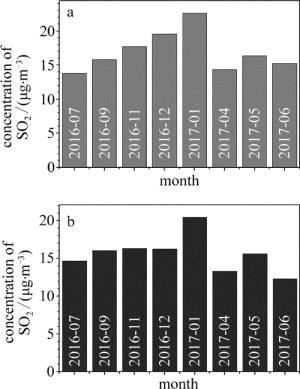
    Figure 5.  Monthly changes in SO2 concentration

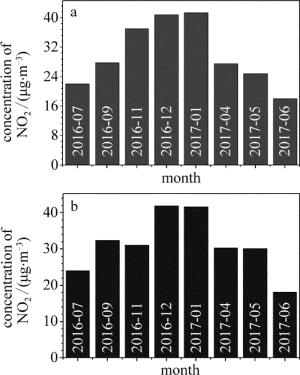
    Figure 6.  Monthly changes in NO2 concentration

    气象部门划分四季通常以阳历3月~5月为春季,6月~8月为夏季,9月~11月为秋季,12月~次年2月为冬季。图 5图 6中分别表示SO2及NO2测量结果以及根据当地气象部门播报的标准结果。测量结果与标准结果变化趋势吻合,均呈现拱形结构,有明显的月份变化规律,即冬季月份气体浓度最大,夏季月份气体浓度最低,春、秋季月份次之。其中,SO2测量值月均质量浓度范围为13.78μg/m3~22.64μg/m3,2016年7月份出现谷值,2017年1月份出现峰值,SO2标准值月均质量浓度范围为12.30μg/m3~20.45μg/m3,2017年6月份出现谷值,2017年1月份出现峰值,NO2测量值月均质量浓度范围为18.00μg/m3~41.37μg/m3,2017年6月份出现谷值,2017年1月份出现峰值,NO2标准值月均质量浓度范围为18.10μg/m3~41.90μg/m3,2017年6月份出现谷值,2016年11月份出现峰值。

    以下对SO2及NO2气体浓度月变化原因进行初步分析。

    (1) 人群活动的影响。不同季节人群活动的强度及方式不同,从而导致这两种气体的产生有季节差异[14-15]; 秋冬两季是采暖季,生物质和煤炭燃烧使得SO2及NO2气体排放量增加,春夏两季相对而言气温较高,无需燃料燃烧供暖,故SO2及NO2气体排放量减少。

    (2) 温度的影响。春夏两季气温高,地表在接收较强阳光辐射的同时向近地面快速传递热量,使得垂直方向上的大气对流运动加强,气体混合作用提高,有利于气体向高空输送扩散,避免其在低空堆积,气体质量浓度降低; 秋冬两季气温低,日照时间短,太阳辐射作用弱,由于低温作用,贴地逆温持续时间较长且相对稳定,不利于气体扩散,气体浓度升高。

    (3) 降水和湿度的影响。降水和湿度是影响气体浓度的重要气象因素。降水对大气中气体具有冲刷稀释作用,降水的同时伴随着空气中湿度增加,SO2及NO2易溶于水与水发生反应,使其浓度降低; 数据所测地点淮南市处于季风气候区,夏季大气层活动强烈,降雨频率高,降雨量大,湿度高,有利于气体的清除与扩散[16-18],气体质量浓度低; 冬季大气层相对稳定,湍流作用减弱,降雨频率及强度较夏季而言弱,湿度低,不利于气体扩散与稀释,气体质量浓度高。

3.   结论
  • 针对淮南地区2016年7月份~2017年6月份中部分月份大气SO2及NO2质量浓度分布廓线,本文中选取其中典型实例对SO2及NO2质量浓度变化进行不同时空尺度特征分析,可大致得出以下结论:(1)同一天夜晚时刻SO2及NO2气体质量浓度大于下午时刻SO2及NO2气体质量浓度;(2)SO2及NO2气体垂直浓度随着高度的增加呈递减趋势;(3)SO2及NO2气体水平浓度月变化表现为冬季月份气体浓度最大,夏季月份气体质量浓度最小,春、秋季月份次之。SO2及NO2浓度变化特征是人群活动和气象条件变化共同作用的结果。

Reference (18)

Catalog

    /

    DownLoad:  Full-Size Img  PowerPoint
    Return
    Return