Advanced Search

ISSN1001-3806 CN51-1125/TN Map

Volume 43 Issue 3
Mar.  2019
Article Contents
Turn off MathJax

Citation:

Segmentation of laser point cloud and safety detection of power lines

  • Received Date: 2018-08-06
    Accepted Date: 2018-10-10
  • In order to detect and analyze the safety of high voltage transmission lines, based on airborne light detection and rangring(LiDAR) power corridor data, a segmentation and extraction algorithm of power line laser point cloud was proposed based on density-based spatial clustering of applications with noise (DBSCAN). This method can realize fast segmentation and extraction of single power line in transmission corridor. Firstly, the point cloud of power line was projected on the x-O-y plane. The projected laser points were fitted linearly by the least square method. Secondly, after calculating the length of transmission corridor, empirical parameters were used to segment power line point clouds. Then, DBSCAN was applied to segment point clouds in the projection plane. Finally, the classification of segmentation clustering results was normalized and the laser point cloud data of a single power line was obtained. The results show that, with this method, fast and accurate segmentation and extraction of power line laser point cloud can be obtained when the piecewise width of the empirical parameter is only needed. According to the segmentation results, the distance between the power line and the objects in the power corridor is calculated and the type and distance of dangerous points can be judged. By comparing and verifying the experiment with the field measurement results, the proposed method has high extraction and measurement accuracy. It can be effectively applied to power line safety detection and analysis.
  • 加载中
  • [1]

    LIU Y, LI Z, HAYWARD R, et al. Classification of airborne LIDAR intensity data using statistical analysis and hough transform with application to power line corridors[C]//Digital Image Computing: Techniques and Applications. New York, USA: IEEE, 2010: 462-467.
    [2]

    GUAN H, YU Y, LI J, et al. Extraction of power-transmission lines from vehicle-borne lidar data[J]. International Journal of Remote Sensing, 2016, 37(1):229-247.
    [3]

    LIN X G, NING X G, DUAN M Y, et al. Clustering of airborne LiDAR point cloud of 3-D powerline reconstruction in a span using stra-tified sampling[J]. Science of Surveying and Mapping, 2017, 42(4):10-16(in Chinese).
    [4]

    WANG P H, XI X H, WANG Ch, et al. Study on power line fast extraction based on airborne LiDAR data[J]. Science of Surveying and Mapping, 2017, 42(2):154-158(in Chinese).
    [5]

    JUN W U, WEI L I, PENG Z, et al. Integrating morphological grayscale reconstruction and TIN models for high-quality filtering of airborne LiDAR points[J]. Geomatics & Information Science of Wuhan University, 2014, 39(11):1298-1303(in Chinese).
    [6]

    XU B, LIU Zh J, WANG J. Extraction and security detection of power line based on laser point cloud data[J]. Laser Journal, 2017, 38(7):48-51(in Chinese).
    [7]

    LIANG H, YUAN Y L, WANG Y D, et al. Study on deformation monitoring of transmission tower by three-dimensional laser scanning technology[J]. Bulletin of Surveying and Mapping, 2017(7):156-157(in Chinese).
    [8]

    CHEN L, LIU Zh J, QIAN J G. Airborne LIDAR point cloud tower inclination judgment[C]//IOP Conference Series: Earth and Environmental Science. Wolfville, Nova Scotia, Canada: Earth and Environmental Science, 2016: 012013.
    [9]

    BIAN H, LIU K. Robustly decoding multiple-line-structured light in temporal Fourier domain for fast and accurate three-dimensional reconstruction[J]. Optical Engineering, 2016, 55(9):093110. doi: 10.1117/1.OE.55.9.093110
    [10]

    DIGITAL GREEN EARTH. UAV Lidar Power Line Inspection Solution[J]. Survey World, 2017(1):72-75(in Chinese).
    [11]

    YU K J. Application research of 3-D laser radar measurement technology for transmission lines[D]. Beijing: North China Electric Power University, 2015(2): 60(in Chinese).
    [12]

    LIN X, NING X, XIA S. A method for powerline LiDAR point cloud segmentation using K-means clustering of a feature space[J]. Science of Surveying & Mapping, 2016, 41(5):60-63.
    [13]

    GONG Y J, MAO W B, BI J T, et al. Three-dimensional reconstruction of indoor whole elements based on mobile LiDAR point cloud data[J]. Proceedings of the SPIE, 2014, 9262:92620O. doi: 10.1117/12.2068790
    [14]

    MELZER T, BRIESE C. Extraction and modeling of power lines from ALS point clouds[C]//Proceedings of 28th Workshop of Austrain Association for Pattern Recognition. Hagenberg, Austria: Austrain Association for Pattorn Relognition, 2004: 47-54.
    [15]

    KIM H B, SOHN G. Point-based classification of power line corridor scene using random forests[J]. Photogrammetric Engineering & Remote Sensing, 2013, 79(9):821-833.
    [16]

    GUO B, HUANG X, ZHANG F, et al. Classification of airborne laser scanning data using Joint Boost[J]. ISPRS Journal of Photogrammetry & Remote Sensing, 2015, 100:71-83.
    [17]

    LIANG J, ZHANG J, DENG K, et al. a new power-line extraction method based on airborne LiDAR point cloud data[C]//International Symposium on Image and Data Fusion. New York, USA: IEEE, 2011: 1-4.
    [18]

    MARTIN E, HANS-PETER K, JÖRG S, et al. A density-based algorithm for discovering clusters in large spatial databases with noise[C]//Proceedings of the Second International Conference on Know-ledge Discovery and Data Mining (KDD-96).Palo Alto, California, USA: AAAI Press, 1996: 226-231.
    [19]

    KHANI O, SHOUSHTARI M Z, ACKLAND K, et al. The structural, magnetic and microwave properties of spherical and flake shaped carbonyl iron particles as thin multilayer microwave absorbers[J]. Journal of Magnetism & Magnetic Materials, 2017, 428:28-35.
  • 加载中
通讯作者: 陈斌, bchen63@163.com
  • 1. 

    沈阳化工大学材料科学与工程学院 沈阳 110142

  1. 本站搜索
  2. 百度学术搜索
  3. 万方数据库搜索
  4. CNKI搜索

Figures(8) / Tables(5)

Article views(6186) PDF downloads(28) Cited by()

Proportional views

Segmentation of laser point cloud and safety detection of power lines

  • 1. Transmission Operation and Maintenance Branch, Guizhou Power Grid Co. Ltd., Guiyang 550000, China
  • 2. Equipment Department, Guizhou Power Grid Co. Ltd., Guiyang 550000, China
  • 3. Power Transmission Operation and Maintenance Branch Machine Patrol Management Office, Guizhou Power Grid Co. Ltd., Guiyang 550000, China
  • 4. Guizhou Electric Power Design & Research Institute, Construction Group Corporation of China, Guiyang 550000, China

Abstract: In order to detect and analyze the safety of high voltage transmission lines, based on airborne light detection and rangring(LiDAR) power corridor data, a segmentation and extraction algorithm of power line laser point cloud was proposed based on density-based spatial clustering of applications with noise (DBSCAN). This method can realize fast segmentation and extraction of single power line in transmission corridor. Firstly, the point cloud of power line was projected on the x-O-y plane. The projected laser points were fitted linearly by the least square method. Secondly, after calculating the length of transmission corridor, empirical parameters were used to segment power line point clouds. Then, DBSCAN was applied to segment point clouds in the projection plane. Finally, the classification of segmentation clustering results was normalized and the laser point cloud data of a single power line was obtained. The results show that, with this method, fast and accurate segmentation and extraction of power line laser point cloud can be obtained when the piecewise width of the empirical parameter is only needed. According to the segmentation results, the distance between the power line and the objects in the power corridor is calculated and the type and distance of dangerous points can be judged. By comparing and verifying the experiment with the field measurement results, the proposed method has high extraction and measurement accuracy. It can be effectively applied to power line safety detection and analysis.

引言
  • 机载激光雷达(light detection and ranging,LiDAR)是一种激光探测与测量技术,具有高精度、高密度、高效率等特点,被广泛应用于林业、电力行业等诸多领域。采用机载LiDAR对输电线路进行扫描,可以快速地获取到输电走廊各个元件的高密度激光点云,包括输电线、杆塔以及周围存在的植被、桥梁、河流、铁路等[1],能够解决传统电力运维方式工作成本高、效率低下并且准确性不高的难题,目前在国家电网和南方电网中得到了广泛的应用[2]

    针对输电线路激光点云的研究中,基于激光点云数据的电力线安全分析是一项重要的研究内容。通过对电力线的3维建模,可以查出周围环境中存在的危险因素,模拟出电力线在最大工况下的风偏、弧垂等情况,有利于进行电力线安全检测分析。目前已有的研究成果中,电力线建模需要4个重要的步骤:电力线点云的提取,即在包含杆塔、地面、植被、道路、房屋等激光点云中分离出电力线点云[3-8];单档电力线激光点云的提取,采用机载LiDAR扫描的输电线路往往具有多档的特性,采用电力线点云坐标与杆塔坐标对比获取单档之间的电力线点云[9-11];单档电力线点云中单条电力线点云的提取;单条电力线的3维建模。

    但是当前单条电力线点云分割提取算法仍然存在许多问题,可以归结为:方法过于复杂,所需参量过多等,比如采用K均值聚类需要初始化聚类数目等参量[12-13];基于Hough变换的聚类方法往往不能实现复杂环境下的电力线分割,无法进行垂直排列的多根电力线检测[12];未考虑分裂导线的建模[14-17];对断裂电力线激光点云聚类效果不佳。

    因此,本文中提出了一种基于LiDAR的单条电力线激光点云分割提取方法,采用具有噪声的基于密度的空间聚类(density-based spatial clustering of applications with noise, DBSCAN)方法,综合考虑电力线断裂等多种因素,无需人工判断电力线条数,进行分割提取;并将提取结果应用于电力线与电力走廊地物距离计算,能够精确地进行电力线路危险点分析。

1.   DBSCAN方法
  • DBSCAN是MARTIN等人于1996年提出的一种基于密度的空间的数据聚类方法,该算法是一种很典型的密度聚类算法[18],和K均值、利用层次方法的平衡迭代规约和聚类(balanced iterative reducing and clustering using hierachies, BIRCH)这些一般只适用于凸样本集的聚类相比,DBSCAN算法既可以适用于凸样本集,也可以适用于非凸样本集。DBSCAN算法一般假定类别可以通过样本分布的紧密程度决定。同一类别的样本,它们之间的紧密相连的,也就是说,在该类别任意样本周围不远处一定有同类别的样本存在。通过将紧密相连的样本划为一类,这样就得到了一个聚类类别。通过将所有各组紧密相连的样本划为各个不同的类别,则得到了最终的所有聚类类别结果。该算法将具有足够密度区域作为距离中心,不断生长该区域,算法基于一个事实:一个聚类可以由其中的任何核心对象唯一确定。该算法利用基于密度的聚类的概念,即要求聚类空间中的一定区域内所包含对象(点或其它空间对象)的数目不小于某一给定阈值。

    该方法和传统的K均值算法相比,最大的不同就是不需要输入类别数K,能在具有噪声的空间数据库中发现任意形状的簇,而不是像K均值,一般仅仅使用于凸的样本集聚类[19]。可将密度足够大的相邻区域连接,能有效处理异常数据,生成聚类簇的形状没有偏倚。基于3维激光点云数据的特征及DBSCAN的优势,故本文中采用DBSCAN方法来实现。

2.   基于DBSCAN的电力线激光点云分割算法
  • 本文中提出基于DBSCAN的电力线激光点云分割方法主要包括以下几个步骤:(1)采用最小二乘法进行电力线点在x-O-y平面上的直线拟合;(2)激光点云长度计算;(3)按照一定的规则对电力线点云进行分段,通过计算得出每一段的投影平面,该平面与第1步中得到的直线垂直,将每段中的电力线点投影到平面得到投影点;(4)采用DBSCAN方法对投影点进行聚类;(5)采用判断距离的方式对每段聚类结果进行整合,得到完整的单条电力线激光点云。

    具体流程如图 1所示。

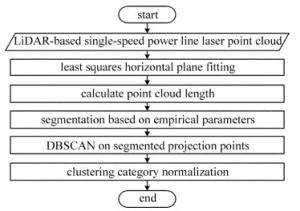
    Figure 1.  Flow chart of power line point cloud segmentation method

3.   算法设计与实现
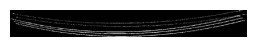
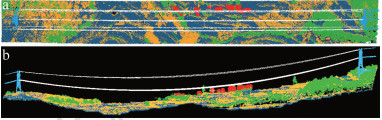
  • 电力线激光点云数据如图 2所示。该数据为贵州省500kV高压输电线路醒福线17#~18#杆塔电力线激光点云数据,采用该数据进行方法验证与分析。

    Figure 2.  Single power line laser point cloud data

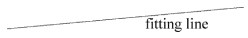
  • 遍历该档内的所有电力线点的水平坐标,采用最小二乘法进行拟合,拟合结果为和电力线走向平行的一条在x-O-y面上的直线,直线方程为:

    式中,k为直线的斜率,b为直线与y轴的交点。图 3展示了单档电力线激光点云的拟合直线。

    Figure 3.  The fitted horizontal line of the laser point cloud data

  • 设任意一点的水平坐标为(x0, y0),其在上述拟合直线的投影点坐标为(xt, yt)。其中xt, yt见下:

    根据上述公式求得所有点在拟合直线上的投影坐标,找到其中xminxmax所对应的投影点,这两点在拟合直线上的距离即为单档电力线激光点云的长度, 见下式:

    由上述公式可以测得图 2中的电力线长度d=501.97m。

  • 根据经验参量将单档内的电力线激光点云进行分段,分段总段数见下式,其中第i(0≤im)段的电力线激光点云投影点横坐标应满足:

    式中,m为电力线激光点云均匀分段数,ls为经验参量,int(  )为将一个数值向下取整为最接近的整数的函数。

    图 2中数据以ls=5.0m(该经验参量应不大于电力线之间的宽度,根据输电走廊电压等级以及安全规范要求设置该参量,一般500kV高压输电线路设置范围为2m~8m,经验参量设置过小,分段数量增多,从而增加聚类过程,降低算法速率; 经验参量设置过大,降低聚类精度,误差增大)进行分段,可分为101段,其中第50段如图 4所示。

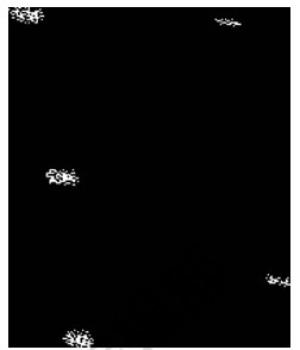
    Figure 4.  Power line laser point cloud data of section 50

  • 找出每一段中所对应的最大的投影点W(xi, yi),定义该点在3维空间中的坐标为W(xi, yi, 0),将处于该段内的所有电力线点云投影到过空间该点并且与拟合直线垂直的平面y=kix+bi上,其中ki为与拟合直线垂直的直线的斜率,bi=yi-kixi为该直线与y轴的交点,设该段内任意一点的坐标为(x, y, z),则对应的投影点坐标(Xt, Yt, Zt)分别为:

    采用DBSCAN方法对投影到平面上的点进行聚类,可以得到电力线条数以及每一段的聚类结果。表 1所示为第5段部分聚类结果。表中数值分别代表激光点坐标xyz以及聚类类别号,由最后的数字组成(0, 1, 2, 3, 4),可知电力线条数为5。

    x y z cluster category number
    464986 3.00393×10⁶ 1322 0
    464986 3.00393×10⁶ 1322.02 0
    464982 3.00391×10⁶ 1309.18 1
    464987 3.00393×10⁶ 1309.22 2
    464986 3.00393×10⁶ 1309.21 2
    464984 3.00392×10⁶ 1309.81 3
    464983 3.00391×10⁶ 1322.32 4
    464982 3.00391×10⁶ 1309.56 1
    464984 3.00392×10⁶ 1309.8 3
    464983 3.00391×10⁶ 1322.27 4

    Table 1.  Segment 5 clustering results

    图 5表示所有分段的聚类结果。不同颜色代表不同类别号,从图中可以看出,聚类结果编号不统一,因此需要进行聚类类别归一化处理,不能简单地将所有的编号一致的聚类结果整合成一条线。

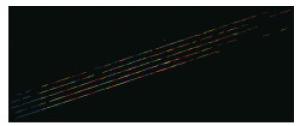
    Figure 5.  Clustering results of all segments

  • 取第1段中聚类结果编号为0的任意一投影点P(x, y),设该点所对应的电力线原始激光点为Q(x0, y0),则设过Q点且平行于拟合直线的直线方程为y=kx+y0-kx0

    从第2段中所有聚类结果找出一点,即在编号为0,1,2,3,4的聚类结果中分别随机找出一点,判断这点到上述直线的距离,距离最近的点所在的聚类结果和第1段中的编号为0的聚类结果为同一条电力线上的点。继续判断第3段、第4段直到第m段。按照上述步骤,可以提取出一条电力线的激光点云数据。

    再重新取第1段中聚类结果编号为1的任意一点,同理可以提取第2条电力线点云数据。

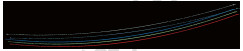
    重复步骤,直到所有电力线点云数据分割完成。图 6所示为贵州省500kV醒福线17#~18#电力线点云数据提取结果。不同的颜色代表不同的电力线,该线路包含5根电力线,其中2根避雷线,3根分裂导线,电力线没有出现断裂。

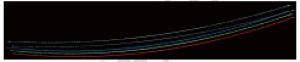
    Figure 6.  Extraction results of power line

4.   安全检测分析
  • 本文中电力线安全检测的分析主要进行危险点距离计算与分析,计算提取的点云数据中电力线与建筑物、公路、河流等走廊地物之间的距离,并进行危险点判别与分析,有利于提高电力巡检效率、降低运维成本与风险,及时发现电力线故障危险位置。因此,针对图 7所示杆塔17#~18#间电力线点云数据进行距离计算与危险点面积统计判别,并且根据输电线路运行规范,判别危险级别。

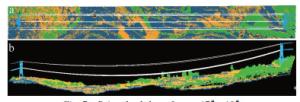
    Figure 7.  Point cloud data of tower 17#~18#

  • 通过采用开源点云库(point cloud library, PCL),将提取出的电力线激光点云作为搜索点,地物点云作为被搜索点,采用半径内搜索(通常半径设置为规程规范中规定的安全距离),可以迅速找出危险点,该输电线路为500kV,故设置搜索半径为7m,计算得出的危险点如图 8所示。

    Figure 8.  Danger point data of tower 17#~18# section

  • 通过将第4.1节中计算所得到的危险点聚类,可以分为7簇,在每一簇中提取距离电力线净空距离最近的一点作为代表点,并通过计算每一簇到电力线的距离范围,可以计算出长度范围和宽度范围。

    由于簇的形状不规则,不能简单地由上述长度范围与宽度范围相乘得到面积,因此本文中采用开源点云库PCL。首先将每一簇投影到x-O-y平面,然后利用PCL现有应用程序编程接口(application programming interface, API)计算投影面的面积作为危险面积。

    计算分析结果如表 2表 3表 4所示。

    ID tower section tree defect ground defect building defect
    serious general serious other serious other
    number area/m2 number area/m2 number area/m2 number area/m2 number area/m2 number area/m2
    1 17#~18# 4 103.0 3 50.2 0 0.0 0 0.0 0 0.0 0 0.0
    total 4 103.0 3 50.2 0 0.0 0 0.0 0 0.0 0 0.0

    Table 2.  Dangerous point statistics in the 17#~18# section of the tower

    ID tower section distance/m left or right distance from the low tower/m coordinate defect type defect level defect space distance/m area/m2
    horizontal vertical clearance
    S.1 17#~18# 498.94 left 36.19~40.63 729330,
    2963010
    tree serious 1.68 6.19 6.41 10.4
    S.2 17#~18# 498.94 left 38.14~42.96 729359,
    2963010
    tree serious 0.52 5.34 5.36 12.7
    S.3 17#~18# 498.94 left 40.67~45.61 729388,
    2963000
    tree serious 1.60 4.66 4.93 7.6
    S.4 17#~18# 498.94 left 41.90~52.56 729423,
    2963000
    tree serious 0.38 3.76 3.78 72.4
    total defect area:103.0m2

    Table 3.  Summary of major defects in the 17#~18# section of the tower

    ID tower section distance/m left or right distance from the low tower/m coordinate defect type defect level defect space distance/m area/m2
    horizontal vertical clearance
    G.1 17#~18# 498.94 left 43.09~47.27 729394,
    2963000
    tree general 2.92 3.81 4.80 8.5
    G.2 17#~18# 498.94 left 44.54~50.90 729405,
    2963010
    tree general 4.83 3.11 5.74 36.8
    G.3 17#~18# 498.94 left 45.32~47.63 729379,
    2963010
    tree general 5.22 3.59 6.33 4.9
    total defect area:50.2m2

    Table 4.  Summary of general defects in the 17#~18# section of the tower

    表 2为17#~18#杆塔之间的危险点统计结果。从表中可以看出,共存在7处危险点,且都为树木危险点,并且按照输电线路运行规程规范可确定重大危险点为4处,一般危险点为3处。表 3为具体的重大危险点所在位置,包括坐标、水平距离、垂直距离、净空距离、按照电力线走向的左侧或右侧、距小号杆塔的距离、档距、危险点面积等。

    为验证表 2表 3表 4所示杆塔17#~18#区间危险点净空距离计算精度,机巡运检中心运行维护人员通过使用高精度激光测距仪等手段进行现场测量分析,得出如表 5所示杆塔17#~18#区间危险点净空距离误差分析报告。其中点云净空距离为根据提取激光点云数据计算得出,测量净空距离为现场测量得出,分析误差结果得出,两者之间最大误差为0.11m,最小误差为0.03m,平均误差为0.0633m,误差在允许范围内,因此, 本文中安全分析计算方法具有较高的计算精度,满足电力线安全检测分析误差要求。

    ID 1 2 3 4 5 6 7
    point cloud clearance distance/m 6.41 5.36 4.93 3.78 4.80 5.74 6.38
    measuring clearance distance/m 6.48 5.29 5.02 3.75 4.76 5.63 6.30
    gap/m 0.07 0.07 0.09 0.03 0.04 0.11 0.08

    Table 5.  Error analysis of clearance distance of dangerous points in the 17#~18# section of the tower

    表 5中系统净空数据来源于系统分析结果,测量净空距离由测量仪器直接测量得来,根据误差数值可以得出,系统分析结果与实际测量结果的最大误差为0.11m,最小误差为0.03m,平均误差为0.0625m;误差分析结果说明系统具有较高的检测分析精度,能够满足输电线路安全检测需求。因此,该系统在电力巡线工程中具有较高的实用性、有效性。

5.   结论
  • 本文中提出了一种基于LiDAR的单档电力线激光点云分割方法,该方法能很好地实现单档电力线激光点云中单条电力线激光点云的提取,在不断裂的电力线激光点云或断裂宽度小于分段宽度的电力线激光点云上实验结果100%精确。基于电力线激光点云分割方法进行电力线安全检测分析,实验结果表明,该方法能够精准地检测计算电力线走廊危险点距离,具有较强的实用性与稳定性。

Reference (19)

Catalog

    /

    DownLoad:  Full-Size Img  PowerPoint
    Return
    Return