Advanced Search

ISSN1001-3806 CN51-1125/TN Map

Volume 43 Issue 2
Jan.  2019
Article Contents
Turn off MathJax

Citation:

Research of dynamic WNMF image fusion algorithm based on NSCT domain

  • Received Date: 2018-04-02
    Accepted Date: 2018-07-18
  • In the process of infrared and visible image fusion, the details of the fusion image are often missing.In order to solve this problem, an improved image fusion algorithm based on nonsubsampled contourlet transform (NSCT) was adopted, which integrated the dynamic weighted non-negative matrix factorization (WNMF) rule into the image fusion.The results show that, the low-frequency and high-frequency parts can be obtained by multi-scale and multi-directional decomposition of two source images by using NSCT algorithm.The dynamic WNMF fusion rule was used as the fusion rule of low frequency parts.The decomposition scale of the highest level in the high frequency part was based on the absolute value method.The matching threshold was set in the other parts of the high frequency part.When the threshold value was lower, the method of region variance based on region energy matching degree was used.When the threshold value is higher, the weighted average method was used.By processing the low frequency part and the high frequency part, the fused image was obtained by NSCT inverse transform.This method effectively improves the definition of the fused image, highlights its details and shortens the calculation time.
  • 加载中
  • [1]

    GAO J S, DONG Y N, SHEN Y, et al. Research on image fusion algorithm based on improved Tetrolet transform[J]. Computer Science, 2015, 42(5):320-322(in Chinese).
    [2]

    MASON W P. Physical acoustics principles and methods[M]. London, UK:Academic Press, 1964:57-89.
    [3]

    MASON W P. Electromechanical transducers and wave filters[M]. London, UK:Van Nostrand Company, 1958:37-43.
    [4]

    CUNHA A L, ZHOU J, DO M N. The Nonsubsampled contourlet transform:theory, design, and applications[J]. IEEE Transactions on Image Processing, 2006, 15(10):3089-3103. doi: 10.1109/TIP.2006.877507
    [5]

    LEE D D, SEUNG H S. Learning the parts of objects by non-negative matrix factorization[J]. Nature, 1999, 401(6755):788-791. doi: 10.1038/44565
    [6]

    GILLIS N, VAVASIS S A. Fast and robust recursive algorithms for separable non-negative matrix factorization[J]. IEEE Transactions on Pattern Analysis and Machine Intelligence, 2014, 36(4):698-714. doi: 10.1109/TPAMI.2013.226
    [7]

    CHIN W S, ZHUANG Y, JUAN Y C, et al. A fast parallel stochastic gradient method for matrix factorization in shared memory system[J]. ACM Transactions on Intelligent Systems and Technology, 2015, 6(1):1-24.
    [8]

    GUILLAMET D, VITRIA J, SCHIELE B. Introducing a weighted non-negative matrix factorization for image classification[J]. Patten Recognition Letters, 2003, 24(14):2447-3454. doi: 10.1016/S0167-8655(03)00089-8
    [9]

    ZHANG L, JIN L X, HAN Sh M, et al. The infrared visible image fusion of non-sampled contourlet transform and regional classification is adopted[J]. Optics and Precision Engineering, 2015, 23(3):810-818(in Chinese). doi: 10.3788/OPE.
    [10]

    GONG M, ZHANG Y S, LI Y J, et al. Regional energy and image from similar NSCT domain image fusion[J]. Transducer and Microsystem Technologies, 2017, 35(5):2096-2436(in Chinese).
    [11]

    SHARIPOV R. Course of differential geometry[M]. New York, USA:Bulletin of the American Mathematical Society, 2014:33.
    [12]

    LIU Sh P, HE Q, SONG Y. Dynamic weighted non-negative matrix factorization and its using research in image fusion[J]. Chinese Journal of Sensors and Actuators, 2010, 23(9):1266-1271.
    [13]

    ZHANG Y, LI Y J, ZHANG K, et al. Fusion of infrared and visible images based on NSCT[J]. Computer Engineering and Applications, 2011, 47(3):196-198(in Chinese).
    [14]

    DENG L, CHEN Y H, LI J, et al. A method of adaptive remote sensing image fusion based on wavelet transforms[J]. Journal Infrared Millim Waves, 2005, 24(1):34-38(in Chinese).
    [15]

    ZHANG Zh J. Research on optimization of fusion algorithm based on NSCT infrared and visible image[J].Infrared Technique, 2017, 38(12):1001-1591(in Chinese).
    [16]

    LI Z H, DONG A G, FENG J H. Regranal fousion algorithm of images based on multistage guide filters.Laser Techlonology, 2016, 40(5):756-761(in Chinese).
  • 加载中
通讯作者: 陈斌, bchen63@163.com
  • 1. 

    沈阳化工大学材料科学与工程学院 沈阳 110142

  1. 本站搜索
  2. 百度学术搜索
  3. 万方数据库搜索
  4. CNKI搜索

Figures(3) / Tables(1)

Article views(5623) PDF downloads(79) Cited by()

Proportional views

Research of dynamic WNMF image fusion algorithm based on NSCT domain

  • Department of Electronic Engineering, School of Electronics and Information Engineering, Shenyang Aerospace University, Shen-yang 110136, China

Abstract: In the process of infrared and visible image fusion, the details of the fusion image are often missing.In order to solve this problem, an improved image fusion algorithm based on nonsubsampled contourlet transform (NSCT) was adopted, which integrated the dynamic weighted non-negative matrix factorization (WNMF) rule into the image fusion.The results show that, the low-frequency and high-frequency parts can be obtained by multi-scale and multi-directional decomposition of two source images by using NSCT algorithm.The dynamic WNMF fusion rule was used as the fusion rule of low frequency parts.The decomposition scale of the highest level in the high frequency part was based on the absolute value method.The matching threshold was set in the other parts of the high frequency part.When the threshold value was lower, the method of region variance based on region energy matching degree was used.When the threshold value is higher, the weighted average method was used.By processing the low frequency part and the high frequency part, the fused image was obtained by NSCT inverse transform.This method effectively improves the definition of the fused image, highlights its details and shortens the calculation time.

引言
  • 随着社会的进步与科技的发展,单一传感器不仅容易受到环境或人为因素的影响,而且所能得到的图像也无法满足人们的需求。科研工作者通过研究后发现,可以使用两个或以上的传感器进行多方位多角度的拍摄,并且通过某种手段将其融合成一幅符合人们需求的图像。从而衍生出图像融合技术。随着融合技术的不断发展,所产生的类别也不断增多,譬如红外与可见光融合技术、高光谱图像融合技术、多传感器多聚集图像融合技术等等。并且根据不同的需求,提取信息的特征层次也不同,从而出现了像素级图像融合、特征级图像融合、以及决策级图像融合3个层次[1]

    contourlet变换是DO与VETERLI在2002年所提出的,这种融合方式不仅具备小波变化的多分辨率视频分析特征,而且具备了较好的各向异性特征[2-3]。但是在利用contourlet变换算法时,必须对源图象使用上采样与下采样方式,这使得其缺少了平移不变性,因此CUNHA等人在2005年提出了具备平移不变性的contourlet变换,即非下采样contourlet变换(nonsubsampled contourlet transform, NSCT)。非下采样contourlet变换由一个非下采样的塔形结构以及一个非下采样的方向滤波带构成,这种图像分解方式是一种灵活的、具备多尺度与多方向性的平移不变图像分解方法[4]

    标准非负矩阵分解(non-negative matrix factorization,NMF)是由LEE等人于2000年提出,它是继多分辨率分析图像融合算法之后的新型算法,并且比其更为优秀[5]。它具备提取向量全局特征的能力,可以将原始矩阵分成非负的基矩阵与非负的权值系数矩阵,从而将源图像的维度进行降低。为了更好地符合人眼的视觉效果,作者对传统的标准NMF采用动态加权的方式进行处理,即对加权非负矩阵分解(weighted NMF, WNMF)进行改进,得到了较好的结果。

1.   NSCT理论
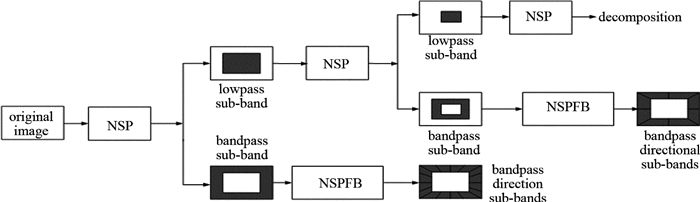
  • NSCT是基于contourlet变换理论所提出的,它具备离散性,是一种多尺度多方向进行图像分解的方法。NSCT变换具有两部分,分别是非采样塔式滤波器(nonsubsamplet pyramid filter bank,NSP)与非采样方向滤波器(nonsubsamplet directional filter bank,NSDFB),二者可以分开进行多尺度与多方向的分析,从而代替了对信号分量进行上采样与下采样的操作。在分解时,先是使用NSP对两幅源图像进行一次多尺度分解,从而得到低通子带与带通子带图像,然后对所得的低通子带图像再次使用NSP进行迭代式分解,与此同时对每一级所得的带通子带图像使用NSDFB进行方向分解,经过这种方式,可以得到若干个多尺度多方向的子带系数(图像),最终连接所处方向相同的奇异点,最终形成轮廓段。其分解步骤如图 1所示。

    Figure 1.  Decomposition steps of NSCT

2.   NMF理论
  • NMF的标准计算公式如下:

    式中,V表示原始的非负矩阵,W表示分解后的非负基矩阵,H表示分解后的非负权值系数矩阵; R表示矩阵分解维数,M表示列,N表示行;并且R满足(N+MR < NM

    对于研究非负矩阵分解来说,目标函数的定义是十分重要的。现阶段有以下两种常用的目标函数:一种是以最小化2个矩阵间的欧式距离作为目标函数[6-7]

    式中,‖ ‖表示模的绝对值。

    VWH=0成立时,目标函数为0。另一种是将最小化的Kullback-Liebler散度作为目标函数:

    式中, ‖表示VWH之间的距离。作者将(2)式作为目标函数,为了进一步提高算法对局部特征的提取能力,通过设计动态加权系数,对重要数据区域进行设计,并且对重要区域提高重建误差的权重,从而使数据重要特征的表达能力得到提高[8]。动态的WNMF迭代规则如下:

    式中, U为加权系数矩阵。

3.   基于NSCT与动态WHMF的融合算法
  • (1) 首先对两幅源图像进行各个层级各方位NSCT分解,得到相应的子带系数,即高频子带系数和低频子带系数,{Cv, j0(x, y), Cv, j, l(x, y)(jj0)}和{Ci, j0(x, y), Ci, j, l(x, y)(jj0)},其中Cj0(x, y)为低频子带系数,Cj, l(x, y)为图像在j尺度和l方向上的高频子带系数。在分解过程中分解级数如果选择过高,会使变化后的较小边缘或者纹理信息丢失,通过前人的大量研究分析可知,分解级数为4层时最优,所以本文中最高分解级数J=4。

    (2) 经过分解所得的红外图像与可见光图像低频子带Ci, j0(x, y)与Cv, j0(x, y),使用动态WNMF融合方法,得到低频子带融合图像Ci, v, j0(x, y)。

    (3) 对红外图像与可见光图像的高频子带Ci, j, l(x, y)与Cv, j, l(x, y)使用基于区域能量匹配度的混合融合规则进行融合。

    (4) 对得到的低频与高频融合系数使用NSCT逆变换,得到最终融合图像Q

  • 对于图像的低频部分来说,大部分的信息都储存在其中,因此该部分反映的是源图像的近似特征。随着图像迭代的增加,融合图像的像素灰度值也会随之动态变化,这就使得融合图像与源图像的灰度分布出现区别,由于图像的各个区域重要程度并不是绝对存在的,所以随着灰度值的变化,各区域重要程度也发生了变化,原有的WNMF这种固定加权系数的融合方法并不能完全体现该变化。

    本文中对低频部分使用动态加权系数融合规则。在迭代过程中,实时的调整加权系数,当迭代结果不等于额定阈值时,调整加权系数,使之大于或等于额定阈值;当迭代结果等于或大于额定阈值时,停止调整加权系数。通过使用这种动态加权系数调整方式,从而提高低频融合部分效果。

    由于人眼对图像的对比度较为敏感,为了达到改善视觉效果的目的,选取的目标函数为与对比度具有同一变化趋势的突变度,对WH的迭代规则进行修改,修改如下:

    式中,Ui, Uv分别表示红外图像和可见光图像的加权余数矩阵; didv分别为红外图像与可见光图像的突变度。

    (7) 式定义了图像灰度突变度,x(m, n)为图像在点(m, n)上的灰度值,μ是图像的平均灰度值。

    以下为低频部分的融合步骤:

    (1) 对Ci, j0(x, y)与Cv, j0(x, y)低频系数矩阵使用行优先方式,将其转变为列向量,得到原始非负矩阵V

    (2) 利用(7)式计算两幅源图像的突变度,得到didv,将较大的一方作为目标突变度。

    (3) 按照参考文献[8]中所述,非负基矩阵的列数被称为特征基,该参量直接决定特征子空间为数。当且仅当特征基为1时,特征基有唯一解,且具备源数据的完整特征,如果将其还原,则可得到源图像的绝大部分信息,此时加权系数矩阵为n×2,系数为0.5,因此这里将特征基设定为1,加权系数矩阵为n×2,元素取值为0.5。

    (4) 一次迭代完成之后,将本次迭代像素突变度与目标突变度相比,若大于目标突变度,则保留其像素加权系数;若小于目标突变度,利用(6)式改变其加权系数,使其等于或大于目标突变度。

    (5) 再次迭代,并重复执行第(4)步。

  • 图像的细节分量大多分布在高频部分,因此其边缘细节信息十分丰富。本文中在高频部分的融合上采取的是混合融合的规则。在迭代过程中,低层提供了较粗糙的信息,为了使边缘的线条更加自然,更好地维护像素邻域之间的相关性,使用基于区域能量匹配的区域方差选大融合方式[9-10];高层所提供的信息较为细腻,各个信息点之间具备的独立性较高,因此使用像素点绝对值取大的融合方式[11]

    其中,区域能量的定义为:

    因为基于区域特征的融合方法为了对比融合图像的特征,会选择某个像素周围的一个领域特征,即窗口大小,在选取时因为3×3尺寸窗口中心为整数值,可以简化索引,并更为直观。所以, 在本文中,M×N取为3×3,窗口掩模ω(m, n)取为$\frac{{{\rm{[1, 2, 1;2, 4, 2;1, 2, 1]}}}}{{{\rm{16}}}} $[12]

    区域能量匹配度的定义为:

    匹配度阈值α的普遍取值为0.5~1,本文中设定为0.7[13]

    区域方差的定义为:

    式中,$\overline A $表示该区域拥有的平均方差,为常量。

    以下为高频部分的融合步骤:

    (1) 融合图像在迭代后的最高层分解尺度J(本文中取J=4)上的各个高频系数取值方法为:

    (2) 融合图像在除J层以外的其它各层中的高频系数,具体融合方式如下:

    Pi, v(x, y) < α时,采用基于能量匹配度的区域方差选大法进行融合:

    Pi, v(x, y)≥α时,则采用加权平均的方式进行融合:

    式中, q1q2为自适应调整因子:

4.   图像融合评价指标及实验结果分析
  • 为了验证本文中所述算法的可行性,试验选取了2组256×256的红外与可见光图像,在core i7处理器的联想电脑上,通过MATLAB2014b对两幅源图像进行融合处理。图 2a图 3a为源红外图像;图 2b图 3b为源可见光图像;图 2c图 3c中使用的方法是contourlet分解,其中低频融合规则为平均,高频为绝对值取大[14]图 2d图 3d的方法为NSCT分解算法,融合规则分别为低频加权平均;高频则分成最高层方差取大,其它层能量取大;图 2e图 3e为WNMF融合算法;图 2f图 3f为本文中所介绍算法;图 2g图 3g为本文中算法所得融合图像f与图像a的差分图像;图 2h图 3h是图像f与图像b的差分图像。

    Figure 2.  Experimental image 1

    Figure 3.  Experimental image 2

    通过比较不同种融合方法下得到融合图像后可以发现,每种算法所得出的融合图像具备不同的特点[15]。同时,在使用客观融合评价指标中的信息熵、平均梯度、标准差以及运行时间可以发现,本文中所用到的算法比起所列举的算法都有不同程度的优化,总的来说,利用本次算法可以得到较为清晰、视觉感较好的融合图像。图像1和图像2各算法融合质量评价指标如表 1所示。

    infornation entropy standard decuation average gredient correlation coefficient distortion cperation time/s
    Fig. 2c 7.0532 7.6095 4.3013 -0.0612 97.0941 30.427
    Fig. 2d 7.0742 7.6417 6.1340 -0.2323 38.1157 24.782
    Fig. 2e 7.0527 7.6049 5.7882 0.8699 6.6102 29.548
    Fig. 2f 7.1634 7.8574 6.7115 -0.4199 33.7592 21.563
    Fig. 3c 6.1885 30.1053 5.0723 0.4842 19.8994 32.650
    Fig. 3d 7.3526 31.5697 6.5345 0.6903 18.9129 28.764
    Fig. 3e 6.7074 35.6624 8.1043 0.6898 20.0759 26.532
    Fig. 3f 7.3674 36.7720 7.1884 0.7042 6.7784 20.875

    Table 1.  Fusion quality evaluation indexes of several algorithms of experimental image 1 and image 2

5.   结论
  • 本文中所提出的基于NSCT与动态WHMF变换相结合的融合方式,有利于红外与可见光图像的信息互补,在实验的基础上,该融合方式不仅可以有效缩短算法运行的时间,而且可以将源图像中大部分的纹理与边缘等细节信息进行提取,符合人眼的观测度,展现出了良好的融合性能。

Reference (16)

Catalog

    /

    DownLoad:  Full-Size Img  PowerPoint
    Return
    Return