 Map
Map


HTML
-
激光增材制造技术是一种以粉末或丝材为原料,通过高功率激光熔化/快速凝固逐层累加,能直接制造出全致密且力学性能优异金属零件的先进制造技术,在航空航天、汽车船舶及武器装备等领域具有广阔的应用前景[1-3]。激光增材制造本身是一个非稳态、极冷极热的瞬态过程,在制造累加过程中局部热输入就必然会导致不均匀的温度场,这种局部热效应就直接表现为熔池在凝固及随后冷却过程中极易形成残余应力。残余应力作为一种内应力,将直接影响成形件的静载荷强度、疲劳强度、抗应力腐蚀等性能及尺寸的稳定性,严重时将直接引发裂纹缺陷[4]。因此,如何减小激光增材制造熔覆层中的残余应力一直是国内外激光加工领域的研究热点。在激光增材制造过程中,工艺参量往往对熔覆层残余应力有着重要影响。KONG[5]等人通过建立单道2维瞬态数学计算模型,研究了激光扫描速率、激光功率、送粉量对沉积高度的影响规律。DAVIM[6]等人采用多元回归的方法建立了熔覆层尺寸的理论模型,获得熔覆层宽度、高度、深度等与工艺参量之间的关系。LIU[7]等人理论推导出熔覆层参量与激光熔覆工艺参量间的关系式,为工艺参量优化选择提供指导。SHI[8]等人对激光增材制造薄壁件的应力场进行了模拟计算,得出最大拉应力区域位于熔覆层与基材连接面上。以上研究中大多给出了工艺参量对熔覆层尺寸的影响及熔覆层最大内应力及对应位置,并没有完整给出工艺参量对熔覆层沿深度方向上应力分布特征的影响规律。
本文中将通过ANSYS软件建立单道熔覆层有限元模型,在温度场计算的基础上进行了间接热力耦合的应力场计算,找出工艺参量如激光功率、扫描速率、送粉量对零件横截面高度方向上残余应力的分布规律,为降低或减少熔覆层残余应力的工艺参量的优化调控提供指导。
-
图 1为金属零件有限元模型。其中熔覆层尺寸为2.2mm×30mm×0.6mm,基材尺寸为50mm×50mm×8mm。熔覆层与基材先采用solid70单元的网格划分进行温度场分析,当进行应力场分析时将solid70单元转换为solid45单元来进行结构分析。在熔覆层及其附近采用小的网格划分,局部放大如图 1b所示,在远离熔覆层的区域选择较大的网格划分。为了得到更准确的结果,网格更细、熔覆层最小的单元尺寸为0.3mm×0.3mm×0.1mm。

Figure 1. Finite element model and mesh generation of laser additive manufacturing
激光增材制造过程是一个复杂的工艺过程,其影响因素较多,不能一一考虑。为了简化计算,本文中建立的模型遵从如下几个假设[8]:(1)基材与金属粉末各向同性;(2)熔覆层表面与空气的对流换热系数一定;(3)不考虑基材与金属粉末的汽化作用;(4)基材与金属粉末的屈服准则采用von Mises准则;(5)金属材料的塑性区段满足流动准则和硬化准则;(6)热源及产生的光斑各项始终性能保持不变;(7)在控制变量的实验中忽略变量改变对其它值的影响。
模拟激光增材制造过程中材料的熔覆行为,主要是通过ANSYS中的“生死单元法”[9]来实现的。所谓“生死单元法”,即是将该单元的刚度(或传导,或其它分析特性)矩阵乘以一个很小的因子,其默认值为1.0×10⁻⁶,从而不对载荷向量生效(但仍然在单元载荷的列表中出现)。同样,被杀死单元的质量、阻尼、比热和其它类似效果也设为0值,被杀死单元的质量和能量将不包括在模型求解结果中,单元的应变在“杀死”的同时也将设为0。当移动热源的光斑覆盖到该单元位置时激活该单元,以此来模拟金属粉末受热与基材形成熔池的过程。因此,只要根据热源移动的路径逐个激活单元,并加载上与热源相对应的生热率,就可以模拟整个激光增材制造过程。
-
激光器产生的热流密度呈现正态高斯分布,故本文中采用移动高斯热源模型与实际情况一致。高斯热源模型表达式为[10]:
式中, Q为在光斑内任意点的热流密度;η为激光利用率;P为激光功率;r为激光光斑半径;R为任意点到热源中心的距离。
激光器在产生瞬时高能热源的同时,随着时间而快速纵向移动,快冷快热。因此热源模型需要定义空间与时间变量。
定义位于熔覆层表面的移动热源中心点(x0, y0):
式中, v为激光移动速率;t为时间。
计算熔覆层表面上任意一点(x,y)到热源中心点的距离:
所以熔覆层表面上任意一点(x,y)的热流密度q可以表示为:
-
金属材料的热物性参量随着温度的变化往往呈现非线性。本文中基材与粉末均为316L不锈钢(00Cr17Ni14Mo2),通过查阅有关文献[11-13],运用插值法和外推法,可以获取所需温度范围内材料的非线性热物性参量和力学性能参量, 如表 1所示。其中c为比热容,κ为导热系数, ρ为密度,E为弹性模量, al为热膨胀系数, v为泊松比, σ为屈服应力,E′为切线模量。
temperature/K c/(J·kg-1·K-1) κ/(W·m-1·K-1) ρ/(kg·m-3) E/ Pa al/K-1 v σ/Pa E′/ Pa 293 477 12.6 8 2.21×10¹¹ 15.3×10⁻⁶ 0.3 0.297×10⁹ 2.21×10¹⁰ 473 515 16.3 8 1.96×10¹¹ 15.3×10⁻⁶ 0.3 0.221×10⁹ 1.96×10¹⁰ 673 550 19.8 8 1.86×10¹¹ 15.3×10⁻⁶ 0.3 0.202×10⁹ 1.86×10¹⁰ 873 582 22.6 8 973 611 23.9 8 1.55×10¹¹ 15.3×10⁻⁶ 0.3 0.099×10⁹ 1.55×10¹⁰ 1073 640 25.5 8 1173 669 26.4 8 1273 675 27.5 8 0.50×10¹¹ 15.3×10⁻⁶ 0.3 0.089×10⁹ 0.50×10¹⁰ 1473 739 29.7 8 0.35×10¹¹ 15.3×10⁻⁶ 0.3 0.059×10⁹ 0.35×10¹⁰ 1703 760 31.7 8 Table 1. Thermophysical parameters of 316L stainless steel
1.1. 几何模型与仿真假设
1.2. 热源模型的建立
1.3. 材料的热物性参量
-
激光增材制造采用的基本工艺参量为:激光功率P=630W,光斑直径D=2.2mm,扫描速率v=6mm/s,送粉量Mp=8g/min,激光离焦量Zl=-3mm。
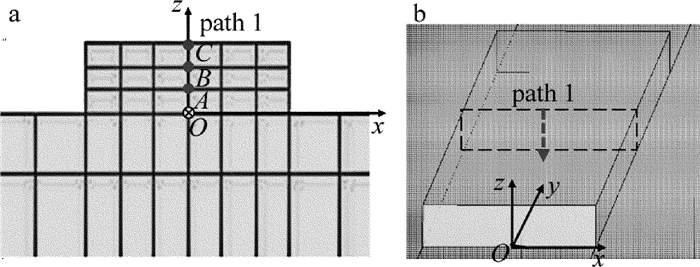
将模型中沿扫描路径方向(纵向)设为y方向,垂直扫描路径方向(横向)设为x方向,熔覆层深度方向为z方向,如图 2所示。在熔覆层一半处(y=15mm)沿x-z平面剖切,在所得截面中选取节点O(x=0mm,z=0mm),A(x=0mm,z=0.2mm),B(x=0mm,z=0.4mm),C(x=0mm,z=0.6mm),并通过节点C, B, A, O作路径path 1,如图 2所示,path 1即熔覆层深度方向上的路径。

Figure 2. Schematic diagram of node and location path
-
整个熔覆过程,总耗时为1000s,其中扫描时间为5s,其余为冷却时间。任意取两个时间瞬态的温度场分布,如图 3和图 4所示。

Figure 3. Transient temperature field distribution cloud at different time

Figure 4. Diagram of temperature field cross-section at 5s
316L的熔点为1398℃,从图 4中可以看出, 光斑经过位置的基材与金属粉末迅速熔化形成熔池,同时温度向周围扩散,熔池前端温度梯度较大,熔池的后端温度梯度较小,越接近尾部温度梯度越小。
-
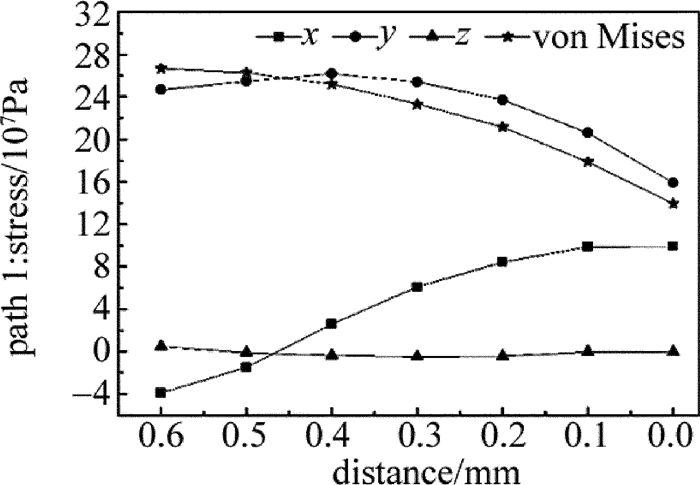
在进行结构分析时,为模拟激光熔覆及冷却过程中的夹板固定,在基板两侧施加线约束。由于对增材制造零件使用性能产生影响的主要是冷却后的残余应力,所以就对冷却1000s后的零件残余应力进行分析。图 5为x方向、y方向、z方向应力及等效应力von Mises的分布云图。将沿路径path 1(熔覆层深度方向上)将对应的值提取出来,其对应x, y, z这3个方向应力和von Mises的结果如图 6所示。

Figure 5. Residual sress field distribution

Figure 6. Residual sress field distribution of x-direction, y-direction, z-direction and von Mises with the depth of the cladding layer increasing
从图 6中可看出,von Mises应力随着深度加深而递减;对于y方向,其残余应力均为拉应力,呈现先增大后降低趋势,且在熔覆层顶部0.2mm处位置存在262MPa的最大拉应力;而x方向的残余应力在熔覆层顶部呈现为压应力,随着熔覆层深度的增加而逐渐变为拉应力,其大小仅次于y方向应力值;z方向的残余应力相比x, y方向数值较小。针对y方向残余应力计算结果随熔覆层深度增加呈现先增大后降低趋势,与参考文献[13]中一致,说明模型的正确性与合理性。
由于x, y方向残余应力远大于z方向残余应力,同时由参考文献[14]可知,激光增材制造中的裂纹主要是沿垂直扫描速度方向扩展。同时x方向的残余应力小于y方向应力值,所以本文中仅实验验证了熔覆层在y方向残余应力的分布规律。
-
为探索激光熔覆层沿深度方向y方向的残余应力分布规律,采用与模拟一致的工艺参量进行单道激光熔覆。试样熔覆后,采用X-350A型X射线衍射仪测定熔覆层的残余应力,测定时采用侧倾固定ψ, 交互关法定峰, 倾斜角ψ分别取为0°, 24.2°, 35.3°, 45°,扫描起始和终止角分别为132°和125°,2θ扫描步距为0.1°,计数时间1.0s,准直管直径2mm。采用1:1的高氯酸与甲醇混合溶液,对试样进行逐层剥离电解抛光,逐层测试熔覆层残余应力,将测定y方向的残余应力结果与数值模拟进行对比,结果如图 7所示。

Figure 7. Residual sress field distribution of y-direction with the depth of the cladding layer
由图 7可知,就y方向残余应力而言,随熔覆深度增加,数值模拟结果与实验测定结果对外表现均为拉应力,且呈现先增大后降低趋于抛物线形状,最大残余应力值处在距离熔覆层顶部0.2mm,实验结果也验证了数值模型正确性。同时也看出数值模拟结果与实验测定结果存在一定差异,分析产生误差原因主要有两部分:一方面很大一部分是由模型假设造成的;另一方面,由于X-350A型X射线衍射仪仅能测量表面应力,所以采用逐层剥离策略测量不同深度熔覆层表面应力时,本身剥离过程会对残余应力产生一定的释放及影响。
-
依据前期工艺试验,分别选取激光功率为430W, 630W, 830W和1030W时,冷却1000s后path 1路径对应下的x方向和y方向的应力分布规律,计算结果如图 8所示。

Figure 8. Residual sress field distribution with different laser powers
由图 8a可知,x方向残余应力在熔覆层表面主要呈现为压应力,随着熔覆层深度增加由压应力转变为拉应力,随激光功率的增大将x方向残余应力逐渐增大。这是因为随着功率增大,激光束照射区域以及基材内的热影响区域的热量将增加,所以冷却时产生的残余应力也随之增大。
由图 8b可知,对于y方向残余应力,熔覆层内部始终表现为拉应力,随着熔覆层深度增加拉应力呈现先增大后降低的抛物线规律,拉应力最大值出现在距离熔覆层顶部0.2mm处;随激光功率的增大其残余应力逐渐降低。由于当功率较小时,激光产生的熔池较小,单位长度上温度梯度较大,造成基材与熔覆层处的残余应力增大。
综上所述,激光功率过大将使x方向残余应力数值增加,而过小将使y方向残余应力增加,因此选择合适的激光功率,可以有效地减小残余应力。
-
同理,依据前期工艺试验,分别选取扫描速率为2mm/s, 6mm/s和8mm/s时,冷却1000s后path 1路径对应下的x方向和y方向的应力分布规律,计算结果如图 9所示。

Figure 9. Residual sress field distribution with different scanning speeds
由图 9看出,x方向残余应力在熔覆层表面也主要呈现为压应力,随着熔覆层深度增加由压应力转变为拉应力,随扫描速度的增加将x方向残余应力逐渐降低;对于y方向残余应力,熔覆层内部也始终表现为拉应力,随着熔覆层深度增加拉应力呈现先增大后降低的抛物线规律,拉应力最大值出现在距离熔覆层顶部0.2mm处;随扫描速率的增大其残余应力呈现增大趋势。
由于在激光熔覆过程中,随扫描速率的增加,熔覆层的宽度变小,沿横向所受的变形阻力相对较小。具体而言,由于扫描速率的增加,使得单位时间内激光照射区域单位面积上的热量减少,在快冷快热的过程中产生的温度差较小,使得产生的横向(x方向)残余应力变小,而另一方面,扫描速率的增加,又将使得熔池整体缩小变浅,单位长度上温度梯度增大,造成熔覆层靠近基材连接处的y方向拉应力增大。所以,选择合适的扫描速率也能够有效降低冷却后的残余应力。
-
激光增材制造过程中,由参考文献[15]可知,送粉量最直接的影响主要体现在熔覆层高度上,送粉量增加将使得熔覆层高度增加。为了研究送粉量对熔覆层深度方向应力场应力场影响规律,不考虑对熔覆层宽度的影响,通过工艺试验得到,当送粉量分别为5g/min, 8g/min和11g/mim时,其对应的熔覆层高度分别为0.4mm, 0.6mm和0.8mm。所以,通过建立不同高度的物理模型来研究送粉量对熔覆层残余应力的影响规律。图 10是冷却1000s后,path 1路径上对应熔覆层高度分别为0.4mm, 0.6mm和0.8mm时,x方向和y方向的应力分布曲线。

Figure 10. Residual sress field distribution with different powder mass flow rates
由图 10可知,x方向残余应力在表面也表现为压应力,随着熔覆层深度增加,由压应力逐渐转变为拉应力,随着送粉量的增大,残余应力数值也随之增大;y方向残余应力整体表现为拉应力,随着熔覆层深度增加,拉应力呈现先增大后降低的抛物线规律,拉应力最大值也出现在熔覆层内部,随着送粉量的增大,熔覆层表面的拉应力也逐渐增大。由于随送粉量增大,连续送入熔池的粉末颗粒的温度相对应熔池温度要低很多,因此进入熔池后相当于给熔池添加了一个强制冷却条件,熔池再熔池深度减小,结果使基体与熔覆层间的温差越大,造成熔覆层残余应力越大[14]。所以,从残余应力角度考虑,在满足送粉量条件下,适当采用较小的送粉量有利于降低残余应力。
2.1. 温度场分布


2.2. 残余应力分布

2.3. 残余应力分布实验研究

2.4. 工艺参量对熔覆层深度方向应力场的影响
2.4.1. 激光功率对熔覆层深度方向应力场的影响

2.4.2. 扫描速率对熔覆层深度方向应力场的影响

2.4.3. 送粉量对熔覆层深度方向应力场的影响

-
(1) 随着熔覆层深度的增加,沿扫描路径方向y方向残余应力均表现为拉应力,呈现先增大后降低趋势,且在距熔覆层顶部位置0.2mm处存在最大拉应力;沿垂直扫描路径x方向,由压应力逐步转变为拉应力,其大小仅次小于y方向应力值;z方向的残余应力相比x, y方向数值较小。
(2) 随着激光功率的增大,熔覆层x方向残余应力逐渐增大,y方向残余应力逐渐降低;随着扫描速率的增大,熔覆层x方向的残余应力将随之减小,而y方向的残余应力将随之增大;随着送粉量的增大,熔覆层x方向和y方向的残余应力均将随之增大。
 DownLoad: