Advanced Search

ISSN1001-3806 CN51-1125/TN Map

Volume 43 Issue 1
Dec.  2018
Article Contents
Turn off MathJax

Citation:

Detection of Cd in table salt by LIBS technology

  • Corresponding author: YOU Libing, lbyou@aiofm.ac.cn
  • Received Date: 2018-03-08
    Accepted Date: 2018-03-26
  • In order to realize the rapid quantitative detection of heavy metal cadmium (Cd) in table salt, 8 groups of salt samples were made by adding heavy metal element Cd and the self-made 193nm excimer laser was used as excitation source. By choosing Cd Ⅰ 228.8nm characteristic spectrum line as analysis line, laser induced breakdown spectroscopy (LIBS) technology was used in theoretical analysis and experimental verification. The experiment results show that, when the delay time is 1.5μs, the better spectral intensity and signal-to-background ratio can be obtained. The spectral line strength has a good linear relationship with mass fraction of Cd. The fitting degree is 0.984, the predicted relative error is less than 7%, and the detection limit is 0.65mg/kg. LIBS detection technology not only has the fast and convenient advantages without the need of tedious sample preparation, but also has high detection precision. It is a very novel and potential detection technology in the field of rapid detection of food safety.
  • 加载中
  • [1]

    HUFF J, LUNN R M, WAALKES M P, et al. Cadmium-induced cancers in animals and in humans[J]. International Journal of Occupational and Environmental Health, 2007, 13(2): 202-212. doi: 10.1179/oeh.2007.13.2.202
    [2]

    BERMEJO-BARRERA P, NANCY M A, CRISTINA D L, et al. Use of Amberlite XAD-2 loaded with 1-(2-pyridylazo)-2-naphthol as a preconcentration system for river water prior to determination of Cu2+, Cd2+ and Pb2+ by flame atomic absorption spectroscopy[J]. Microchimica Acta, 2003, 142(1/2): 101-108.
    [3]

    MOOR C, LYMBEROPOULOU T, DIETRICH V J. Determination of heavy metals in soils, sediments and geological materials by ICP-AES and ICP-MS[J]. Mikrochimica Acta, 2001, 136(3/4): 123-128.
    [4]

    RADZIEMSKI L, CREMERS D. A brief history of laser-induced breakdown spectroscopy: From the concept of atoms to LIBS 2012[J]. Spectrochimica Acta, 2013, B87: 3-10.
    [5]

    SHAO Y, ZHANG Y B, GAO X, et al. Latest research on and applications progress in laser-induced breakdown spectroscopy[J]. Spectroscopy and Spectral Analysis, 2013, 13(10): 2593-2598(in Ch-inese).
    [6]

    TIAN Z H, DONG M R, LU J D, et al. Laser-induced breakdown spectroscopy in spatial distribution of methane laminar diffusion flame[J]. Laser Technology, 2018, 42(1):60-65(in Chinese).
    [7]

    LANG A, ENGELBERG D, SMITH N T, et al. Analysis of contaminated nuclear plant steel by laser-induced breakdown spectroscopy[J]. Journal of Hazardous Materials, 2018, 345: 114-122. doi: 10.1016/j.jhazmat.2017.10.064
    [8]

    MA C H, CUI J L. Quantitative analysis of composition in molten steel by LIBS based on improved partial least squares[J]. Laser Technology, 2016, 40(6):876-881(in Chinese).
    [9]

    LOEBE K, UHL A, LUCHT H. Microanalysis of tool steel and glass with laser-induced breakdown spectroscopy[J]. Applied Optics, 2003, 42(30): 6166-6173. doi: 10.1364/AO.42.006166
    [10]

    SUN L, YU H, CONG Z, et al. Applications of laser-induced breakdown spectroscopy in the aluminum electrolysis industry[J]. Spectrochimica Acta, 2018, B142:29-36.
    [11]

    ZHU Y Q, ZHONG X, HE Y, et al. Measurement of alkali content in Zhundong coal after chemical fractionation treatment by LIBS method[J]. Laser Technology, 2017, 41(1):101-105 (in Ch-inese).
    [12]

    LIU X Y, WANG Zh Y, HAO L Q, et al. Application of laser induced breakdown spectroscopy technology in biomedicine field[J]. Laser Technology, 2008, 32(2): 134-136(in Chinese).
    [13]

    CHEN X, LI X, YANG S, et al. Discrimination of lymphoma using laser-induced breakdown spectroscopy conducted on whole blood samples[J]. Biomedical Optics Express, 2018, 9(3): 1057-1068. doi: 10.1364/BOE.9.001057
    [14]

    MONCAYO S, MANZOOR S, ROSALES J D, et al. Qualitative and quantitative analysis of milk for the detection of adulteration by laser induced breakdown spectroscopy (LIBS)[J]. Food Chemistry, 2017, 232: 322-328. doi: 10.1016/j.foodchem.2017.04.017
    [15]

    BELL C R, BARNETT C, PILLAI S, et al. Detection of salmonella from food using UV-laser induced breakdown spectroscopy[J]. Biophysical Journal, 2011, 100(3): 488-488.
    [16]

    HE X W, HUANG L, LIU M H, et al. Determination of Cd in rice by laser-induced breakdown spectroscopy[J]. Applied Laser, 2014, 34(1): 72-75(in Chinese).
    [17]

    YAO M, YANG H, HUANG L, et al. Detection of heavy metal Cd in polluted fresh leafy vegetables by laser-induced breakdown spectroscopy[J]. Applied Optics, 2017, 56(14): 4070-4075. doi: 10.1364/AO.56.004070
    [18]

    PAN A M, LIU L M, LIN Z X, et al. Analysis of the Cd element in soil by laser-induced breakdown spectroscopy[J]. Applied Laser, 2012, 32(2): 124-127(in Chinese).
    [19]

    KASEM M A, GONZALEZ J J, RUSSO R E, et al. Effect of the wavelength on laser induced breakdown spectrometric analysis of archaeological bone[J]. Spectrochimica Acta, 2014, B101: 26-31.
    [20]

    BURAKOV V S, TARASENKO N V, NEDELKO M I, et al. Analysis of lead and sulfur in environmental samples by double pulse laser induced breakdown spectroscopy[J]. Spectrochimica Acta, 2009, 64(2): 141-146. doi: 10.1016/j.sab.2008.11.005
  • 加载中
通讯作者: 陈斌, bchen63@163.com
  • 1. 

    沈阳化工大学材料科学与工程学院 沈阳 110142

  1. 本站搜索
  2. 百度学术搜索
  3. 万方数据库搜索
  4. CNKI搜索

Figures(4) / Tables(2)

Article views(5198) PDF downloads(99) Cited by()

Proportional views

Detection of Cd in table salt by LIBS technology

    Corresponding author: YOU Libing, lbyou@aiofm.ac.cn
  • 1. Anhui Province Key Laboratory of Photonic Devices and Materials, Anhui Institute of Optics and Fine Mechanics, Hefei Institutes of Physical Sciences, Chinese Academy of Sciences, Hefei 230031, China
  • 2. School of Science Island, University of Science and Technology of China, Hefei 230026, China
  • 3. Intelligent Manufacturing Institute, Hefei University of Technology, Hefei 230009, China

Abstract: In order to realize the rapid quantitative detection of heavy metal cadmium (Cd) in table salt, 8 groups of salt samples were made by adding heavy metal element Cd and the self-made 193nm excimer laser was used as excitation source. By choosing Cd Ⅰ 228.8nm characteristic spectrum line as analysis line, laser induced breakdown spectroscopy (LIBS) technology was used in theoretical analysis and experimental verification. The experiment results show that, when the delay time is 1.5μs, the better spectral intensity and signal-to-background ratio can be obtained. The spectral line strength has a good linear relationship with mass fraction of Cd. The fitting degree is 0.984, the predicted relative error is less than 7%, and the detection limit is 0.65mg/kg. LIBS detection technology not only has the fast and convenient advantages without the need of tedious sample preparation, but also has high detection precision. It is a very novel and potential detection technology in the field of rapid detection of food safety.

引言
  • 食盐是人类膳食中重要的调味品,而且是维持人体正常生理机能必不可少的成分, 对于维持人体酸碱平衡、渗透压、神经和肌肉正常兴奋等功能都有着十分重要的作用。食盐的主要成分是氯化钠,质量分数高于0.95,还含有钡盐、镁、锌、氯化物、硫酸盐等杂质。

    近现代以来,随着工业化的发展,人类的生产和生活产生了严重的重金属污染问题,严重污染了土壤、水质和大气。其中主要的重金属元素包括铅、镉、铬、汞等。重金属污染通过食物链过程对人类的健康产生了巨大的威胁。例如,长期摄入或接触Cd会导致乳腺、肾脏、前列腺等器官发生癌症病变的风险大大上升[1]。食盐的来源主要有海盐、矿盐、井盐等。海水污染会导致食盐制取过程中存在重金属残留的危险,不良商家在食盐中添加工业用盐从而导致重金属中毒的新闻屡见不鲜,食盐受重金属污染引发的食品安全问题也备受关注。

    食品安全问题是人们最为关注的问题之一,食盐是每天都要摄取的必需品,所以对于食盐质量把控显得尤为重要。目前有许多针对食品中的重金属残留检测方法的研究,传统的检测方法有原子吸收光谱法(atomic absorption spectroscopy,AAS)、电感耦合等离子体发射光谱法(inductively coupled plasma-atomic emission spectroscopy,ICP-AES)等[2-3]。这些方法虽然可以实现对食品中的重金属的高精度检测,但是这些传统方法在检测前都需要通过化学方法处理样品,不仅需要大量的准备时间而且实验投入巨大,甚至在处理样品的过程中会产生化学污染问题,且无法实现多元素同时检测。所以, 需要有一种更加方便快捷的新方法去实现食品中重金属残留的检测。

    激光诱导击穿光谱(laser induced breakdown spectroscopy,LIBS)技术是一种新的分析技术,几乎所有的物质都可以通过LIBS技术来分析其化学成分。LIBS技术相比传统的分析技术有着较少样品准备工作、快速检测、原位检测、多元素同时检测等[4-5]技术优点,还可针对气态[6]、固态[7]和液态[8]多种样品形态进行检测,因此被广泛地应用于工业生产[9-11]、生物医疗[12-13]、食品安全[14-15]等诸多领域。HE等人利用LIBS技术对大米中的镉元素进行定量分析,通过光谱数据建立预测模型,结果表明,一元二次线性回归建立的定量分析模型预测精度更高,可实现对大米中Cd的快速精确检测[16]。YAO等人利用LIBS技术对新鲜蔬菜叶中的重金属Cd进行检测,使用偏最小二乘多元回归模型对光谱数据处理,多条特征谱线(Cd Ⅱ 214.43nm, Cd Ⅱ 226.5nm, Cd Ⅰ 228.8nm)参与数据模型的建立与预测,获得较好的检测效果[17]。PAN等人使用LIBS技术对土壤中的Cd进行检测,对实验参量进行了优化,分析了累加次数、通保护气体等实验条件对定量分析的影响[18]。优化后的实验线性拟合度为0.99155,检测限为59μg/g,表明了该方法可以有效地提升LIBS的检测精度。

    作者基于LIBS技术实现对食盐中重金属元素Cd的质量分数检测,优化实验参量,提高LIBS检测精度,为LIBS技术在食品安全快速检测领域的应用做出相关的探究。

1.   实验样品和装置
  • 实验装置由激光器、光纤光谱仪、3维位移台、光学器件、计算机等组成,如图 1所示。激光光源采用的是自制ArF准分子脉冲激光器,激光器工作波长为193nm,重复频率1Hz~20Hz,脉宽20ns,最大能量为160mJ。该激光器可通过设置放电电压改变激光输出能量,支持TTL电平外触发。准分子激光拥有波长短、光子能量大、热效应小等[19]优点,应用于LIBS检测能够有效地减少自吸收、降低分馏效应等。通过直径为5mm的光阑选取激光光斑作为入射激光,激光光束经过焦距为49mm的紫外聚焦物镜(ThorLabs,LMU-3X-193)对光斑进行聚焦成像,光斑直径约为300μm,能量密度为6J/cm2~15J/cm2。入射到食盐样品表面,激发产生等离子体,通过焦距为20mm的透镜将激发产生的光谱信号耦合至光纤探头中,传至八通道光纤光谱仪(Avantes,AVS-RACKMOUNT-USB2)进行光谱信号的采集。光谱仪测量范围320nm~1070nm,分辨率为0.06nm~0.13nm,积分时间最短为1.05ms,本实验中采用2ms积分时间。本系统采用光谱仪触发激光器的工作方式。为避免激光对同一点进行多次采集,将样品摆放在3维位移台上(ZoLix,MC600),光谱采集过程中样品在x-y平面以500μm/s的速率进行移动。

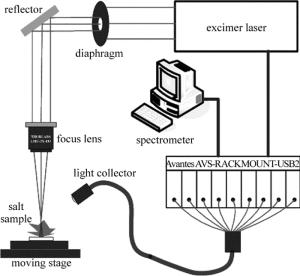
    Figure 1.  Schematic diagram of LIBS

  • 实验中所用食盐为合肥地区市售食盐(中盐,精制食用盐),使用电子天平称取8份等量食盐,每份5g。使用氯化镉分析纯(国药集团,CdCl2·2.5H2O,纯度不小于99.0%)配置Cd浓度为1mg/mL的标准溶液。向食盐中分别加入不同量的标准溶液,制备出镉元素质量分数不同的食盐样品。添加去离子水使其混合均匀,将其自然风干,研磨之后各取3g样品,利用压片机在25MPa的压强下保持10min,将食盐样品压制成直径为25mm,厚3mm的圆片,将食盐样品圆片按照Cd元素的质量分数编号,如表 1所示。

    No. salt weight/g weight ofthe added Cd/mg mass fraction of Cd
    1 5 0.2 40×10-6
    2 5 0.4 80×10-6
    3 5 0.8 160×10-6
    4 5 1 200×10-6
    5 5 1.5 300×10-6
    6 5 2 400×10-6
    7 5 3 600×10-6
    8 5 5 1000×10-6

    Table 1.  Mass fraction of Cd in table salt

2.   实验结果与讨论
  • 实验中分别对Cd质量分数为表 1中的食盐样品圆片进行了LIBS实验,记录了食盐样品波长范围在190nm~330nm的光谱,对比含Cd和不含Cd食盐样品的光谱区别。如图 2所示,食盐中是否含有Cd可以通过Cd的特征谱线判断; 同时还发现食盐在该波段出现了Mg元素的特征峰,说明食盐中存在少量的Mg元素。实际上食盐中大部分的物质都是NaCl,但由于Na元素的发射谱线基本不在该波段,所以不会对Cd的判断产生干扰。根据美国NIST数据库可以得到,在该波段Cd的原子谱线Cd Ⅰ 228.8nm的发射相对强度最强(1500), 且周围不存在明显的干扰峰,故选择Cd Ⅰ 228.8nm作为分析谱线。由于添加的Cd量较少,该波段的其它特征峰没有出现。实验表明,随着Cd质量分数的增大,该波段的其它Cd特征峰会逐渐出现,例如Cd Ⅱ 214.44nm, Cd Ⅱ 226.5nm。本文中主要针对食盐中的低质量分数重金属残留检测,故选择Cd Ⅰ 228.8nm作为分析线较为合适。

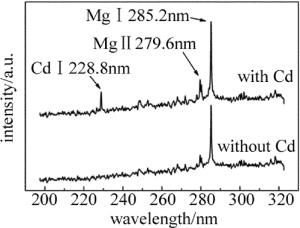
    Figure 2.  Spectra contrast between salt samples with Cd and without Cd

  • 光谱采集延迟时间是LIBS技术中一项重要的参量,光谱强度和信背比(signal-to-background ratio, SBR)随着延迟时间的变化曲线图如图 3所示。Cd Ⅰ 228.8nm光谱强度随着延迟时间的增加一开始基本不变,延时1.4μs后开始急剧下降,基本符合等离子体光谱演化的过程。SBR表示的是光谱强度信号与背景噪声的比值,其中背景噪声选择的是没有特征峰的波长为231nm~232nm波段的光谱信号平均值,延时1.6μs时SBR最大为16.8。选择合适的延迟时间需要综合考虑光谱强度和SBR两者,选择延迟时间为1.5μs时,既能获得较高的光谱信号也能获得较高质量的SBR。

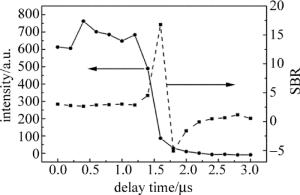
    Figure 3.  Variations of 228.8nm intensity and SBR with delay time

  • 根据等离子体发光机理,在同等条件下的LIBS检测中,Cd的特征光谱会随着样品中的Cd质量分数的增加而增加,其关系为:

    式中,a是定量分析系数,与样品蒸发和激发过程有关实验系统参量;b为自吸收系数,通常b≤1,在待测元素质量分数较低时,自吸收不明显,b≈1;w为待测元素的质量分数。在相同的实验条件下,对自制的8组样品进行LIBS检测。积分时间为2ms,光谱采集延迟时间为1.5μs。实验时使用激光能量为6mJ,光斑直径约为300μm,能量密度约为8.5J/cm2。对8组样品进行LIBS检测时,每组样品采集8幅光谱图,每幅光谱是通过10点平均,共64幅光谱图。其中编号为1, 2, 4, 6, 7和8的食盐样品作为标定组,编号为3,5的食盐样品作为验证组。分别将光谱数据求平均、标准差、相对标准差值(relative standard deviation, RSD),如表 2所示。用标定组数据绘制Cd元素的定标曲线,如图 4所示。图 4中横坐标w表示Cd的质量分数;纵坐标表示的是Cd元素的特征峰(Cd Ⅰ 228.8nm)的光谱强度。同时加入各组样品光谱值的标准差作为误差棒。由图可知, 定标曲线的线性拟合度为0.984。

    No. average standard deviation relative standard deviation/%
    calibration 1 259.9 40.3 15.5
    2 322.6 44.4 13.8
    4 441.6 45.0 10.2
    6 585.9 24.9 4.3
    7 750.8 45.9 6.1
    8 1260.6 127.8 10.1
    validation 3 366.2 43.5 11.9
    5 506.6 47.6 9.4

    Table 2.  The average of spectrum(228.8nm)

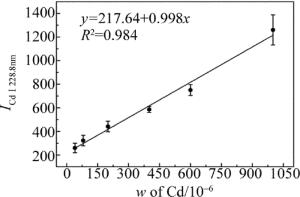
    Figure 4.  Relationship between calibration ICd Ⅰ 228.8nm and mass fraction of Cd

    利用拟合曲线对验证组数据对食盐样品中Cd质量分数的预测,其预测相对误差分别为6.98%和3.47%。说明该定标曲线对食盐中Cd的质量分数具有较好的分析效果,使用该定标曲线可实现对食盐样品中Cd元素的定量分析。根据检测限(limit of detection, LOD)计算公式[20]

    式中, σb为背景噪声的标准差,K为定标曲线的斜率。σb为本实验所得64幅光谱图中波长为231.0nm的空白处光谱强度计算得到的背景噪声标准差, σb=21.58%;由图 4可知定标曲线的斜率K=0.998。由公式可计算出该实验对食盐中的重金属Cd的检测限为0.65mg/kg。

3.   结论
  • 本文中利用LIBS技术对食盐中重金属元素Cd的质量分数进行检测,选择Cd Ⅰ 228.8nm作为Cd元素的分析线,通过特征谱线的强度与元素质量分数之间的关系,建立定标曲线,实现对食盐中Cd元素的定量分析。通过光谱强度以及信背比与光谱采集延时的关系确定最佳的延迟时间为1.5μs。结果表明,光谱强度与Cd质量分数之间存在明显的线性关系,拟合度R2=0.984,食盐中Cd质量分数预测值与标准值相对误差低于7%,检测限为0.65mg/kg,可实现食盐中重金属Cd严重超标的快速预检(国标GB2762-2012食盐标准规定食盐中Cd限量不大于0.5mg/kg)。LIBS技术可以通过检测设备性能的提升以及相关的光谱数据处理方法来进一步提高该方法的检测能力,充分发挥其快速高效、精准检测等优点,并应用于食品安全检测领域。LIBS技术相较传统分析技术有着快捷方便、无需繁琐样品准备等优点,对于实现食品中重金属污染的快速、准确检测有着重要意义。该研究成果可为食品安全监测设备的研发提供实验依据,还可对食品中的其它重金属污染检测提供借鉴作用。

Reference (20)

Catalog

    /

    DownLoad:  Full-Size Img  PowerPoint
    Return
    Return