Advanced Search

ISSN1001-3806 CN51-1125/TN Map

Volume 42 Issue 4
May  2018
Article Contents
Turn off MathJax

Citation:

Measurement of concentration and temperature based on fiber loop ring-down spectroscopy

  • Corresponding author: WANG Fang, 1142811709@qq.com
  • Received Date: 2017-09-22
    Accepted Date: 2017-10-27
  • In order to improve the sensitivity and stability of concentration and temperature measurement, the optical loss in the optical fiber system was monitored by means of time-domain analysis. A sensing system based on fiber loop ring-down spectroscopy (FLRDS) was proposed. Based on the measurement results of concentration and temperature, parameter selection of the core-offset sensing structure was analyzed experimentally. The effect of intra-cavity signal amplification on pulse intensity and pulse number was studied. The results show that, when the interference length L and offset D are 4cm and 3.75μm respectively, interference effect is optimal. Pulse peak intensity is 4 times that without intra-cavity amplification and pulse number is bigger. When the sucrose and glucose concentration is 0.100g/mL~0.400g/mL, concentration sensitivities are 756.51μs/(g/mL) and 909.07μs/(g/mL), and the detection limit is 0.0014g/mL. The temperature sensitivity is 1.83μs/℃ in the range of 30℃~200℃. The design and research of this system provide valuable guidance for sensing application of concentration and temperature.
  • 加载中
  • [1]

    BROWN R S, KOZIN I, TONG ZH G, et al. Fiber-loop ring-down spectroscopy[J]. Journal of Chemical Physics, 2002, 117(23):10444-10447. doi: 10.1063/1.1527893
    [2]

    GIEL B, RUDY P, GERARD M. Cavity ring-down spectroscopy:Experimental schemes and applications[J]. International Reviews in Physical Chemistry, 2000, 19(4):565-607. doi: 10.1080/014423500750040627
    [3]

    TONG Z, WRIGHT A, MCCORMICK T, et al. Phase-shift fiber-loop ring-down spectroscopy[J]. Analytical Chemistry, 2004, 76(22):6594-9. doi: 10.1021/ac0491253
    [4]

    CROSSON E R. A cavity ring-down analyzer for measuring atmospheric levels of methane, carbon dioxide, and water vapor[J]. Applied Physics, 2008, B92(3):403-408.
    [5]

    LIU Y, LIU B, FENG X, et al. High-birefringence fiber loop mirrors and their applications as sensors[J]. Applied Optics, 2005, 44(12):2382-2390. doi: 10.1364/AO.44.002382
    [6]

    STEWART G, ATHERTON K, CULSHAW B. Cavity-enhanced spectroscopy in fiber cavities[J]. Optics Letters, 2004, 29(5):442-444. doi: 10.1364/OL.29.000442
    [7]

    PU S, GU X. Fiber loop ring-down spectroscopy with a long-period grating cavity[J]. Optics Letters, 2009, 34(12):1774-1776. doi: 10.1364/OL.34.001774
    [8]

    ANDERSON D Z, FRISCH J C, MASSER C S. Mirror reflectometer based on optical cavity decay time[J]. Applied Optics, 1984, 23(8):1238-1245. doi: 10.1364/AO.23.001238
    [9]

    CHEN N, XU P, PANG F, et al. Low-loss fiber-optic intrinsic fabry-perot micro-cavity interferometric sensor[C]//Microwave Conference, 2008 China-Japan Joint. New York, USA: IEEE, 2008: 612-615.
    [10]

    SÁNCHEZ M D, KUZIN E A, IBARRAESCAMILLA B, et al. Dual-wavelength fiber laser based on fine adjustment of cavity loss by a fiber optical loop mirror[J]. Proceedings of the SPIE, 2013, 8601:860126. doi: 10.1117/12.2002059
    [11]

    SILVA S, MÃGALHAES R, PÉREZ-HEPRERA R A, et al. Fiber cavity ring down and gain amplification effect[J], Photonic Sensors, 2016, 6(4):324-327. doi: 10.1007/s13320-016-0309-9
    [12]

    LIU K, LIU T G, PENG G D, et al. Theoretical investigation of an optical fiber amplifier loop for intra-cavity and ring-down cavity gas sensing[J]. Sensors & Actuators, 2010, B146(1):116-121.
    [13]

    GOUVEIA C, AVELINO J, JORGE P A S, et al. Fabry-Pérot cavity based on a high-birefringent fiber Bragg grating for refractive index and temperature measurement[J]. IEEE Sensors Journal, 2012, 12(1):17-21.
    [14]

    BAO J L, ZHANG X M, CHEN K Sh, et al. Progresses and applications of fiber grating sensor[J]. Laser Technology, 2000, 24(3):174-178(in Chinese).
    [15]

    LU P, MEN L Q, SOOLEY K, et al. Tapered fiber Mach-Zehnder interferometer for simultaneous measurement of refractive index and temperature[J]. Applied Physics Letters, 2009, 94(13):131110. doi: 10.1063/1.3115029
    [16]

    LUO H D, HUANG Y L. Design of a single channel optical switch based on all-fiber Mach-Zehnder interferometer[J]. Laser Technology, 2012, 36(4):438-440(in Chinese).
    [17]

    HIRAYAMA N, SANO Y. Fiber Bragg grating temperature sensor for practical use[J]. ISA Transactions, 2000, 39(2):169-173. doi: 10.1016/S0019-0578(00)00012-4
    [18]

    WU D, ZHU T, CHIANG K S, et al. All single-mode fiber Mach-Zehnder interferometer based on two Peanut-shape structures[J]. Journal of Lightwave Technology, 2012, 30(5):805-810. doi: 10.1109/JLT.2011.2182498
    [19]

    LIU H L, CHEN Y, CHEN L J, et al. Concentration and temperature sensing accurately in a concatenated FBG and LPG[J]. Optik-International Journal for Light and Electron Optics, 2015, 126(6):649-654. doi: 10.1016/j.ijleo.2015.01.015
    [20]

    HAO Q, HE L, SONG Y. Real-time measurement of concentration and temperature of solution by two different wavelengths Mach-Zehnder interferometry during crystal growth[J]. Proceedings of the SPIE, 2005, 5638:216-222. doi: 10.1117/12.574561
  • 加载中
通讯作者: 陈斌, bchen63@163.com
  • 1. 

    沈阳化工大学材料科学与工程学院 沈阳 110142

  1. 本站搜索
  2. 百度学术搜索
  3. 万方数据库搜索
  4. CNKI搜索

Figures(8)

Article views(5326) PDF downloads(173) Cited by()

Proportional views

Measurement of concentration and temperature based on fiber loop ring-down spectroscopy

    Corresponding author: WANG Fang, 1142811709@qq.com
  • 1. Image Center of Xinxiang Central Hospital, Xinxiang 453000, China
  • 2. College of Electronic and Electrical Engineering, Henan Normal University, Xinxiang 453007, China

Abstract: In order to improve the sensitivity and stability of concentration and temperature measurement, the optical loss in the optical fiber system was monitored by means of time-domain analysis. A sensing system based on fiber loop ring-down spectroscopy (FLRDS) was proposed. Based on the measurement results of concentration and temperature, parameter selection of the core-offset sensing structure was analyzed experimentally. The effect of intra-cavity signal amplification on pulse intensity and pulse number was studied. The results show that, when the interference length L and offset D are 4cm and 3.75μm respectively, interference effect is optimal. Pulse peak intensity is 4 times that without intra-cavity amplification and pulse number is bigger. When the sucrose and glucose concentration is 0.100g/mL~0.400g/mL, concentration sensitivities are 756.51μs/(g/mL) and 909.07μs/(g/mL), and the detection limit is 0.0014g/mL. The temperature sensitivity is 1.83μs/℃ in the range of 30℃~200℃. The design and research of this system provide valuable guidance for sensing application of concentration and temperature.

引言
  • 光纤环形腔衰荡光谱(fiber loop ring-down spectroscopy, FLRDS)是一种高灵敏光谱测量技术,结合了光纤传感和腔衰荡光谱(cavity ring-down spectroscopy, CRDS)的高灵敏特性,适用于光纤传输的低损耗过程,且不受光源功率波动的影响[1-4]。与传统的CRDS系统相比,FLRDS系统采用光纤环而非高反射率的反射镜构成光学谐振腔[5-7]。而由高反射率(反射率R>99%)反射层或高分光比(99: 1)光纤耦合器构成的光纤环形腔,其缺点是当光脉冲耦合到环形腔时,几乎100%存在耦合损耗[8-10]。解决该问题的有效途径是采用掺铒光纤放大器(erbium doped fiber amplifier, EDFA)进行腔内信号放大来补偿损耗,从而增大环形腔的衰减时间来提高测量精度。目前,国内外关于腔内信号放大的报道很多,如SILVA等人[11]论证了EDFA对光纤环内信号放大的影响;LIU等人[12]设计了一种用于腔内和衰荡腔气体检测的光纤放大环(optical fiber amplifier loop, OFAL),且两种形式的理论灵敏度分别达到1mg/L和10mg/L。

    近年来,基于布喇格光纤光栅(fiber Bragg grating, FBG)[13-14]和马赫-曾德尔干涉仪(Mach-Zehnder interferometer, MZI)[15-16]的发展,不同类型的光纤浓度和温度传感系统得到广泛研究。HIRAYAMA等人[17]研制了一种实用的通入式FBG温度传感器,该传感器嵌入在传统的热电偶外壳中,灵敏度为10.3pm/℃。WU等人[18]采用一种基于MZI花生形状的光纤结构用于温度测量,发现当干涉仪长度L=22mm时,温度灵敏度达到约46.8pm/℃。LIU等人[19]提出了将强FBG和弱长周期光栅(long period grating, LPG)级联同时测量温度和溶液浓度的方法,并对耦合模理论和实验进行了分析。HAO等人[20]采用非接触式MZI实时测量液相溶液浓度和温度的变化,研究了溶液温度、浓度和折射率之间的关系。这些光纤传感结构虽然性能优越,但受到光源波动和系统连接损耗等问题的影响,限制了传感器的进一步发展。

    本文中提出的基于FLRDS的浓度和温度传感系统,结合腔衰荡技术和光纤传感器的优越性,利用单模光纤(single mode fiber, SMF)错位熔接于光纤环形腔内制作成传感头。实验分析了错位传感结构的参量选择,并研究了空载时腔内信号放大对脉冲强度和脉冲数量的影响。然后通过浓度和温度实验对该系统的传感特性进行测试分析,得到良好的灵敏度和检测限。

1.   实验装置
  • 图 1是基于FLRDS的传感系统示意图。实验中所用光纤耦合器的分光比为99: 1, 采用一段2m的掺铒光纤(20.04dB/m @980nm Furukawa)和980nm抽运光源(LC962UF74P-20R/750mW, 974nm Oclaro)通过一个980nm/1550nm波分复用器(wavelength division multiplexer, WDM)制成EDFA,光纤环的长度约为3.6km,隔离器的作用是确保信号单向传输,避免光源被损坏。蝶形分布反馈式半导体激光器(DFB LD sfl-19807 Thorlabs)作为激光源。LD控制器的输出电流和温度分别设置为101mA和25℃,然后由数字信号发生器(33500b Keysight)产生的一系列脉冲波(频率f=1kHz,电压V=2V,周期T=14μs)通过“模拟调制输入”端口输送到LD控制器调制成脉冲光。经调制的脉冲光从耦合器1(coupler 1)的1%臂耦合到光纤环路中,围绕光纤环路循环,然后经耦合器2(coupler 2)的1%臂被光电探测器(Thorlabs PDA10CS-EC)转换成电信号,并最终显示在数字示波器(DSO6054A Agilent)上。

    Figure 1.  Experimental setup of based on FLRDS

2.   实验原理
  • 为了分析干涉对错位参量的依赖性,制作两套不同错位量D和不同干涉长度L的干涉仪。通过使用不同错位量和不同干涉长度的干涉仪获得的透射谱如图 2所示。可以看出,干涉谱受错位量和干涉长度参量变化的影响。对于本研究中使用的传感器,在考虑错位量大小和插入损耗之间的折衷时,选择了3.75μm作为错位量。同样,从干涉谱强度及干涉稳定性的角度考虑,传感器长度为4cm被选定为最佳干涉长度。

    Figure 2.  Transmission spectrum

    传感头的结构示意图如图 3a所示。一段长度为L=4cm的单模光纤(SMF-28 Corning)错位熔接于两段SMF之间,错位量D=3.75μm。图 3b为光学显微镜下的错位结构,放大倍数为50倍,SMF的芯/包层直径DSMF=9.2μm/125μm。当脉冲信号到达第1个错位点时,由于模式不匹配,包层中的多种模式被激发,脉冲信号分为两部分:一部分沿着纤芯;另一部分在包层内传输,然后在第2个错位点重新耦合到纤芯中。当错位点处的浓度或温度改变时,导致芯/包层模式的有效折射率发生变化,在传输过程中产生光程差,从而引起干涉。经传感头后的输出光强描述为:

    Figure 3.  a—schematic diagram of a sensor head b—core-offset photograph under light microscope

    式中,Ico是纤芯模的光强,Icl, mm阶包层模的光强,ϕm是光纤环内脉冲光的相位差,表示为:

    式中,Δneff, m=neff, coneff, cl, m代表有效折射率差,neff, co是纤芯的有效折射率,neff, cl, mm阶包层的有效折射率,L是干涉长度(干涉仪的有效长度),λ是光波波长。基于干涉理论,透射光谱中第m阶的波长λm表示为:

    由(1)式~(3)式可知,传感头外部浓度或温度的变化导致相位变化,最终输出光强会相应改变。时域法通常是通过监测光纤环路中光脉冲的衰减寿命来确定光纤环内的光损耗。下式描述了示波器检测到的光强的时间衰减特性:

    式中,I是第N次光脉冲在t0+(N-1)T时的输出光强,I0是在时间t0时的初始光强,且t=t0+(N-1)T是输出脉冲光强的采样时间。环形腔的衰减时间τ被定义为光衰减到其初始光强的1/e所需的时间,该表达式为:

    式中,d是光纤环腔的长度,c是光速,n是光纤环腔的折射率,G是EDFA的增益,A是空载时的总损耗(包括光纤环腔的吸收、光纤耦合器的插入损耗、光纤的散射损耗和光纤的连接损耗), B是由浓度和温度引起的传输损耗。AG在(5)式中是定值,τ仅与B有关, 即当浓度或温度改变时,腔内传输损耗将相应改变。因此,浓度或温度可利用衰减时间与浓度或温度之间的关系求得。

3.   实验和结果
  • 图 4为EDFA的增益光谱,光谱分析仪为YOK- OGAWA的AQ6370C型号,扫描范围为600nm~1700nm,最小分辨率为0.02nm。实验中选取的是1550nm处的一个波长,增益平坦度不影响传感测量。在相同条件下,腔内信号放大和无放大时的衰减光谱如图 5所示。可观察到腔中有EDFA的脉冲峰值强度是无EDFA时的4倍且脉冲峰数更多,便于对数据采集处理,使得测量精度和效率更高。

    Figure 4.  Gain spectrum of EDFA

    Figure 5.  Ring-down spectrum with and without EDFA

  • 在溶液浓度传感实验中,传感头固定于光纤支架上并置于玻璃容器中,温度保持在25℃,蔗糖和葡萄糖溶液的浓度范围为0.100g/mL~0.400g/mL, 变化量为0.05g/mL。图 6为不同浓度时的脉冲衰减曲线。

    Figure 6.  Fitting curves of ring-down spectrum under different solutions

    图 6可以看出,脉冲衰减时间随浓度的增大而减小。将浓度与衰减时间拟合,得到浓度和衰减时间之间呈良好的线性关系,如图 7所示。结果表明,在0.100g/mL~0.400g/mL浓度范围内,蔗糖和葡萄糖溶液的灵敏度分别为756.51μs/(g/mL)和909.07μs/(g/mL),检测限达到0.0014g/mL,分辨率高。

    Figure 7.  Relationship between ring-down time and concentration for sucrose and glucose solution

  • 将传感头置于温控箱(DHG-9036A上海精宏)内进行温度传感实验。温度的变化范围为30℃~200℃,间隔为10℃,通过记录衰减时间与温度之间的对应关系,实现了温度测量。图 8a为所测衰减时间与温度的拟合曲线,由实验结果可知,温度灵敏度为1.83μs/℃,相关系数R2=0.99985。每个温度条件下独立测量10次,实验结果取平均值,从而得到温度对应的衰减时间。取温度110℃为例,10次实验的衰减时间变化如图 8b所示,可以看到衰减时间变化量保持在±0.1μs以内,测量数据的标准差为0.068μs,其值仅为测量均值的0.036%,这一结果表明该传感系统具有稳定性和可重复性。

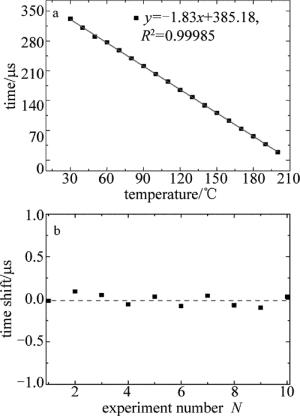
    Figure 8.  a—relationship between ring-down time and temperature in experiment b—ring-down time shift of ten experimental results at 110℃

4.   结论
  • 为解决浓度和温度传感中灵敏度低和稳定性差的问题,采用时域分析法监测光纤系统中的光损耗,从而提出了一种基于FLRDS的光纤传感系统。实验分析了错位传感结构的参量选择,并对空载时腔内信号放大对脉冲强度和脉冲数量的影响进行了研究,得到脉冲强度是无腔内放大时的4倍。该系统检测的是信号的衰减时间而非光强,因此光源的稳定性对信号影响较低。实验表明,该系统在对浓度和温度的测量中反应显著、拟合度高,且在0.100g/mL~0.400g/mL的浓度范围内,检测限达到0.0014g/mL。在温度传感实验中,当温度从30℃以10℃为间隔增加到200℃时,实现了1.83μs/℃的温度灵敏度。通过110℃的温度重复性实验,得到测量数据的标准差为0.068μs,其值仅为测量均值的0.036%,重复性良好,在浓度和温度的实际应用测量中具有广阔前景。

Reference (20)

Catalog

    /

    DownLoad:  Full-Size Img  PowerPoint
    Return
    Return