Advanced Search

ISSN1001-3806 CN51-1125/TN Map

Volume 42 Issue 3
Mar.  2018
Article Contents
Turn off MathJax

Citation:

2-D lifting wavelet de-noising method for Rayleigh BOTDA system

  • Corresponding author: SHANG Qiufeng, lindashqf@126.com
  • Received Date: 2017-07-07
    Accepted Date: 2017-08-25
  • In order to solve the problem that the sensor signal is seriously disturbed by noise in a Brillouin optical time domain analysis (BOTDA) system based on Rayleigh scattering, the 2-D lifting wavelet transform algorithm was used to convert the measured signal from 1-D space to 2-D space, and the noise was reduced by threshold. Through the theoretical analysis and experimental verification, the traditional wavelet and 2-D lifting wavelet denoised data were obtained. The results show that the signal-to-noise ratio of the 2-D lifting wavelet transform is about 10dB higher than that of the traditional wavelet transform, and the computation amount is reduced by 1/3. The 2-D lifting wavelet makes full use of the time correlation of the measured signal, the transformation structure is simple, the operation speed is quick and the noise reduction effect is superior to the traditional wavelet. It is suitable for noise reduction in a Rayleigh BOTDA system. The results of this paper are of great reference to the research of signal denoising in optical fiber sensing systems.
  • 加载中
  • [1]

    CUI Q S, PAMUKCU S, LIN A, et al. Distributed temperature sensing system based on rayleigh scattering BOTDA[J]. Sensors Journal IEEE, 2011, 11(2):399-403. doi: 10.1109/JSEN.2010.2066558
    [2]

    ZHANG C, YU W F, XIA M, et al. Analysis of optical signal characteristics of optical fiber stimulated Brillouin scattering[J]. Laser Technology, 2016, 40(3):363-366(in Chinese).
    [3]

    WANG Y Q, HE J, MA Y, et al.Effect of random noise on measurement of marine brillouin laser radar[J]. Laser Technology, 2015, 39(1):6-12(in Chinese).
    [4]

    DAKIN J P, PRATT D J, BIBBY G W, et al. Distributed optical fibre Raman temperature sensor using a semiconductor light source and detector[J]. Electronics Letters, 1985, 21(13):569-570. doi: 10.1049/el:19850402
    [5]

    FARAHANI M A, WYLIE M T V, CASTILLO-GUERRA E, et al. Reduction in the number of averages required in BOTDA sensors using wavelet denoising techniques[J]. Journal of Lightwave Technology, 2012, 30(8):1134-1142. doi: 10.1109/JLT.2011.2168599
    [6]

    KE T B, LIN L, LI Y Q, et al.Study on denoising method of time-domain reflected signal in brillouin optical cable[J]. Laser Technology, 2014, 38(3):311-315(in Chinese).
    [7]

    WANG W, XIANG Z, WANG Z D.Denoising for optic gyroscope based on wavelet full frequeney-domain threshold processing[J]. Infrared and Laser Engineering, 2012, 41(12):3401-3405(in Chinese).
    [8]

    CHEN G, ZHU X F, XU Q Q, et al.Application of wavelet and sparse decomposition in discontinuous thin film denoising[J]. Laser Technology, 2014, 38(4):546-550(in Chinese).
    [9]

    QUAN Z, ZHANG B H.Application of an improved wavelet threshold algorithm in laser interrogation[J]. Laser Technology, 2014, 38(2):218-224(in Chinese).
    [10]

    CHEN Y, CHENG Y, LIU H. Application of improved wavelet a-daptive threshold de-noising algorithm in FBG demodulation[J]. Optik-International Journal for Light and Electron Optics, 2017, 132(3):243-248.
    [11]

    ZHAO L, LIU H, XU SH C, et al.Comparative study on the analysis of fiber vibration signals by HHT and CWT[J]. Laser Technology, 2017, 41(2):260-264(in Chinese).
    [12]

    LIU L, YU M, YANG R J, et al. Wavelet de-noising for fiber Raman temperature sensing system[J]. Chinese Journal of Lasers, 2013, 40(6):0605005. doi: 10.3788/CJL
    [13]

    CHEN S Y, LIU J X, DING Y.Study on fusion method of infrared and X-ray image based on wavelet transform[J]. Laser Technology, 2015, 39(5):685-688(in Chinese).
    [14]

    ZHAO R, GU G H, YANG W.Implementation of visible light image based on polarization imaging[J]. Laser Technology, 2016, 40(2):227-231(in Chinese).
    [15]

    ZHAO L J, LI Y Q.Research on temperature feature extraction of BOTDR system based on wavelet transform[J]. Electrical Measurement and Instrumentation, 2015, 52(1):19-23(in Chinese).
    [16]

    CAI Z H, CHEN W J, ZHONG M.Application of several wavelets in 3-Dimensional surface survey[J]. Laser Technology, 2015, 39(5):610-616(in Chinese).
    [17]

    FARAHANI M A, CASTILLO-GUERRA E, COLPITTS B G. Acce-leration of measurements in BOTDA sensors using adaptive linear prediction[J]. IEEE Sensors Journal, 2013, 13(1):263-272. doi: 10.1109/JSEN.2012.2213153
    [18]

    ZHAO SH Q, PANG F F, HE M T, et al.Study on signal processing of optical fiber coherent optical time domain reflectometer based on gray image[J]. Chinese Journal of Lasers, 2015, 42(3):0305001(in Chinese). doi: 10.3788/CJL
    [19]

    SOTO M A, RAMI'REZ J A, THÉVENAZ L.Intensifying Brillouin distributed fibre sensors using image processing[J].Proceedings of the SPIE, 2015, 9634:96342D.
    [20]

    LIU A L. Dual filtering algorithm for infrared image based on lifting wavelet transform[J]. Laser Technology, 2015, 39(4):545-548(in Chinese).
  • 加载中
通讯作者: 陈斌, bchen63@163.com
  • 1. 

    沈阳化工大学材料科学与工程学院 沈阳 110142

  1. 本站搜索
  2. 百度学术搜索
  3. 万方数据库搜索
  4. CNKI搜索

Figures(4)

Article views(4519) PDF downloads(143) Cited by()

Proportional views

2-D lifting wavelet de-noising method for Rayleigh BOTDA system

    Corresponding author: SHANG Qiufeng, lindashqf@126.com
  • Department of Electronic and Communication Engineering, North China Electric Power University, Baoding 071003, China

Abstract: In order to solve the problem that the sensor signal is seriously disturbed by noise in a Brillouin optical time domain analysis (BOTDA) system based on Rayleigh scattering, the 2-D lifting wavelet transform algorithm was used to convert the measured signal from 1-D space to 2-D space, and the noise was reduced by threshold. Through the theoretical analysis and experimental verification, the traditional wavelet and 2-D lifting wavelet denoised data were obtained. The results show that the signal-to-noise ratio of the 2-D lifting wavelet transform is about 10dB higher than that of the traditional wavelet transform, and the computation amount is reduced by 1/3. The 2-D lifting wavelet makes full use of the time correlation of the measured signal, the transformation structure is simple, the operation speed is quick and the noise reduction effect is superior to the traditional wavelet. It is suitable for noise reduction in a Rayleigh BOTDA system. The results of this paper are of great reference to the research of signal denoising in optical fiber sensing systems.

引言
  • 基于瑞利散射的布里渊光时域分析系统是一种单端布里渊光时域分析(Brillouin optical time-domain analysis, BOTDA)系统。通过在光纤同一端同时入射抽运脉冲光和连续光,将连续光的后向瑞利散射作为探测光,与相向传播的抽运脉冲光发生受激布里渊作用, 实现光纤的分布式测量[1]。单端入射的优点使得瑞利BOTDA系统在海底光缆、输电线路、桥梁等不便于双端入射的大型结构中有广泛的应用前景。

    在瑞利BOTDA系统中,通过扫描微波频率,得到一系列不同扫频信号下的布里渊时域信号,对光纤每个位置上的布里渊时域信号功率值进行洛伦兹拟合,得到3维布里渊信号增益谱,从而获得沿光纤的布里渊频移分布。瑞利散射光随着传感距离的增加呈指数式衰减,测量数据被多个噪声源污染,严重干扰信号的本质特征,使频谱无法较好拟合,造成布里渊频移测量误差,限制了传感距离。因此,有必要对测量信号进行降噪处理[2-3]

    常规采用累加平均算法对测量信号降噪。累加平均法容易实现,但是计算时间长,需要较大的存储空间[4]。小波变换[5-16]、自适应滤波技术[17]作为有效的降噪工具被广泛应用。参考文献[5]中将累加平均法和小波阈值法结合应用于BOTDA系统,在相同的测量精度下节省了92%的测量时间。参考文献[6]中讨论了布里渊光时域反射(Brillouin optical time-domain reflection, BOTDR)系统中小波阈值降噪的最优参量设置问题。参考文献[7]中根据陀螺信号噪声的宽频带特点,同时对小波分解高低频系数进行阈值处理,降噪效果优于传统阈值法。参考文献[10]中提出新的阈值函数,克服了硬阈值函数的伪吉布斯现象和软阈值函数的固定偏差。

    上述算法均是在1维空间对每个扫描频率下数据降噪,只去除了测量信号在时间域的相关性,忽略不同扫描频率下的测量信号空间域的相关性。将测量信号的空间信息和时间信息相关联,以2维数组的形式保存,归一化映射到(0~255)后显示为灰度图像[18-19],已有的各种图像处理技术均可以用于对2维测量信号降噪处理。本文中采用2维提升小波变换算法,将测量信号从1维空间转换到2维空间,进行阈值降噪处理。

1.   基于提升格式的2维小波变换
  • 2维小波变换用同一组滤波器分别对行和列进行1维小波变换。首先对2维矩阵的每一行提升分解得到低频信息和高频信息,再对列分解,则2维矩阵经过一层小波变换分解为近似系数,水平细节系数,垂直细节系数和对角细节系数。多层2维小波分解需要对近似系数重复分解过程直到分解到指定层数。

    小波变换的运算量由低通滤波器和高通滤波器的长度决定。令低通滤波器长度为h,高通滤波器长度为g,基于MALLAT算法的传统小波分解一层所需的运算量为C=2(h+g)+2。设待分解原始信号的长度为L,进行1维k层小波分解所需的运算量为LC(1-2-k)。进行mn行(L=m×n)2维小波分解时,每列进行列变换所需计算量为nC(1-2-k),对于m列则为mnC(1-2-k)。同理,行变换的计算量为mnC(1-2-k),总计算量为2mnC(1-2-k)。2维小波分解的计算量是1维小波分解的2倍。为了减少计算量,采用提升格式的2维小波变换。

  • 传统的小波变换以傅里叶变换为基础,通过对函数的伸缩平移实现多分辨率分析,被称为第1代小波变换。提升小波变换是对传统小波变换的改进,摆脱了傅里叶变换,避免了传统小波中基于卷积算法的冗余计算,可实现原位计算,对内存需求量小。正反变换的架构完全相同,反变换只是正变换的逆向操作,算法简单、速度快,适合并行处理,易于硬件实现,在信号处理领域有广阔的应用前景[20]

    提升算法将小波变换过程分为分解、预测和更新。

    (1) 分解。将输入的离散信号x[n]按照奇偶性分解xe[n]和xo[n]两个子集,即:

    (2) 预测。利用信号x[n]相邻采样点间具有相关性,可以通过偶数采样点预测奇数采样点,即xo′[n]=F(xe[n]),F为预测算子,预测误差作为小波系数:

    (3) 更新。构造更新算子U与预测的小波系数d[n]作用,叠加到原偶数序列xe[n],得到原信号的近似,即尺度系数:

    提升方案的重构过程与分解互逆。本文中选用系数简单的bior2.2小波函数,低通滤波器长度为5,高通滤波器长度为3。

    基于提升格式的bior2.2小波对信号的分解重构表达式为:

    式中,d(n)是高频细节系数,a(n)是低频近似系数; s(2n)和s(2n+1)是重构信号的偶数部分和奇数部分。

2.   实验系统
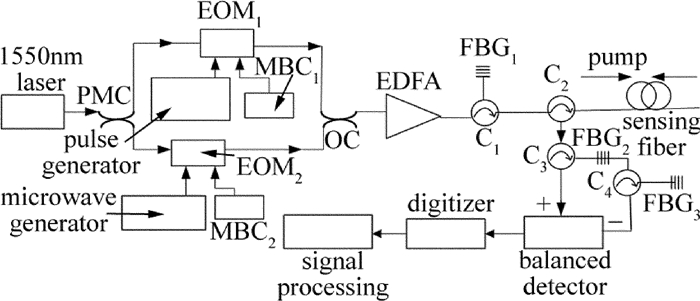
  • 搭建瑞利BOTDA实验系统如图 1所示。采用中心波长为1550.12nm、输出功率为12.55dBm的分布反馈式半导体激光器,由50/50的保偏耦合器(polarization maintaining coupler, PMC)分为两路。上支路光信号经40dB高消光比的电光调制器1(electro-optical modulator, EOM)EOM1调制,EOM1射频口接脉冲信号源,偏置口接偏压控制器1(maintain bias controller, MBC)MBC1锁定在谷点,产生重复频率38kHz、脉宽100ns的基频脉冲光。下支路光经photline马赫-曾德尔电光调制器EOM2调制,EOM2射频口接微波信号源,控制其调制频率,偏置口接偏压控制器(MBC2)锁定在谷点产生抑制载波的1阶双边带连续光,1阶上边带波长为1550.0411nm,下边带波长为1550.2149nm。脉冲光与连续光经过光耦合器(optic-coupler, OC)合成后,经掺铒光纤放大器(erbium doped fiber amplifier, EDFA)放大、光栅1(fiber Bragg grating, FBG)FBG1滤除自发辐射(amplified spontaneous emission, ASE)噪声后通过光环形器C2进入传感光纤。光栅FBG1的3dB带宽范围为1550.026nm~1550.276nm,包含1阶双边带和0阶基带,用于滤除放大后的ASE噪声;光栅FBG2的3dB带宽范围为1549.724nm~1550.096nm,只包含1阶上边带,用于滤除基带和下边带;光栅FBG3的3dB带宽范围为1550.180nm~1550.544nm,包含1阶下边带,用于滤除基带和上边带。

    Figure 1.  Architecture of Rayleigh BOTDA system

    探测信号为脉冲基底1阶双边带的后向瑞利散射光,包括斯托克斯光(1阶下边带)和反斯托克斯光(1阶上边带),与相向传输的脉冲基带信号发生受激布里渊散射作用后,返回入射端携带受激布里渊散射信息的探测光,经环形器C2入射到环形器C3,通过FBG2反射出反斯托克斯边带,经由环形器C3进入平衡检测器的负极;FBG2透射的其它光成分通过环形器C4,经过FBG3反射出斯托克斯边带进入平衡检测器的正极。平衡检测器输出差分信号由数据采集卡采集,在计算机上进行信号处理。

3.   信号降噪与结果分析
  • 瑞利BOTDA系统检测光纤布里渊频移时,通过扫描微波频率,得到一系列不同扫频信号下的1维信号,见下式:

    式中,ν1, ν2, …, νm为扫描频率; z1, z2, …, zn为光纤位置; S1, S2, …, Sm为扫描频率ν1, ν2, …, νm下得到的m组1维信号。将m组1维信号按列存储,得到mn行的2维矩阵M,见下式:

    设扫描频率步进为Δf,脉冲宽度和采样频率共同确定的光纤位置间隔为Δz,矩阵的行坐标i表示第i个光纤位置,列坐标j表示第j个扫描频率,则:

    在坐标为(i, j)位置处的元素值为在扫描频率νj下光纤z处的布里渊时域信号功率值P,即M((νj-ν1)/Δf, zz)=P。2维矩阵的列向量代表布里渊功率值随光纤长度的分布,即实际测量信号,包含空间信息,行向量代表布里渊功率值随扫描频率的分布,即布里渊增益谱信号,包含时间信息。布里渊功率值与光纤长度和扫描频率间均存在非线性关系,即2维矩阵的行向量和列向量间均存在相关性。因此采用2维小波变换,可以同时去除行列向量的相关性,达到良好的降噪效果。

    在10.81GHz~10.92GHz范围内扫描微波频率,获得不同扫频下的测量曲线如图 2a所示;结合布里渊功率与光纤长度、扫描频率的关系得到3维布里渊增益谱如图 2b所示; 3维图的俯视图即为结合了测量信号空间信息和时间信息的2维矩阵,如图 2c所示。

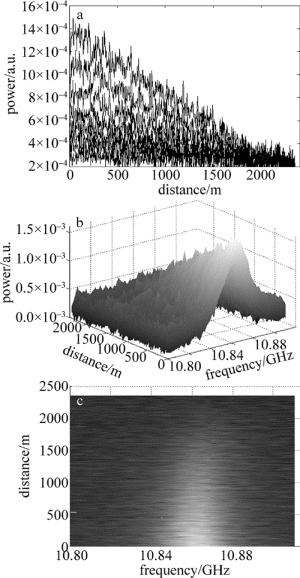
    Figure 2.  a—measure signals at different scan frequencies b—3-D graph of measurement signals c—top view of 3-D figure

  • 对上述预处理后的2维信号降噪步骤如下:(1)采用提升格式的双正交小波bior2.2对2维图像信号进行小波分解,得到近似系数和细节系数; (2)保留近似系数,对细节系数软阈值量化,得到新的阈值系数;(3)对阈值处理后的细节系数和最高分解层的近似系数利用提升算法重构,得到降噪后的信号。

  • 采用2维提升小波阈值降噪后结果如图 3所示。

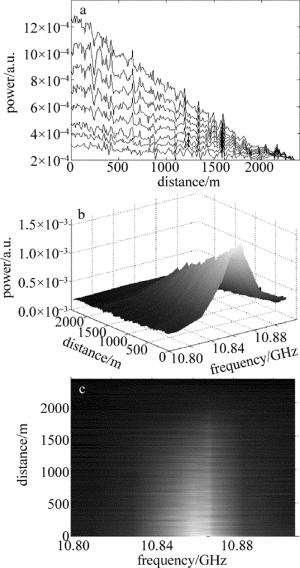
    Figure 3.  a—denoised signals at different scan frequencies b—3-D graph of denoised signals c—top view of 3-D figure

    图 3可以看出,降噪后测量曲线波动减小,图像更加光滑。

    通过信噪比(signal-to-noise ratio, SNR)和算法运算量指标将传统1维小波和2维提升小波降噪进行对比。分别在分解层数为2~8时计算传统1维小波和2维提升小波降噪信号的信噪比,如图 4所示。

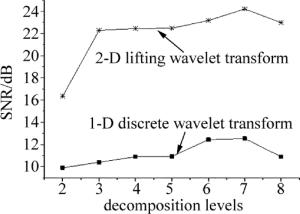
    Figure 4.  Noise reduction effect under different decomposition layers

    图 4可知,在分解层数为2~7时,随着分解层数增加,信噪比提高,当分解层数为8时,信噪比下降。这是因为分解层数过多时,低频域有用信号的特性被当作高频噪声滤除,实际信号丢失严重。2维提升小波降噪和1维传统小波降噪相比,信噪比提高了10dB左右,降噪效果明显优于1维传统小波。

    bior2.2小波低通滤波器长度为5,高通滤波器长度为3。对1维信号基于MALLAT算法一层分解的运算量为18, 基于提升格式分解运算量为6(见(4)式),2维信号基于提升格式分解运算量为12。因此2维提升分解比传统1维小波分解运算量减少了1/3。

4.   结论
  • 小波的提升方案避免了传统小波中基于卷积算法的冗余计算,算法简单、速度快;2维小波变换能利用不同扫描频率下得到的测量信号间的相关性,降噪效果优于1维小波变换。本文中综合考虑降噪效果和计算量,采用2维提升小波变换对瑞利BOTDA系统的测量信号降噪处理,结果表明,和传统降噪方法相比,2维提升小波降噪信号的信噪比提高10dB左右,减少1/3的运算量,适用于瑞利BOTDA系统降噪,该方法也适用于其它的光纤传感系统降噪。

Reference (20)

Catalog

    /

    DownLoad:  Full-Size Img  PowerPoint
    Return
    Return