Advanced Search

ISSN1001-3806 CN51-1125/TN Map

Volume 41 Issue 5
Sep.  2017
Article Contents
Turn off MathJax

Citation:

Analysis of high-power disk laser welding status based on multi-feature fusion

  • Corresponding author: GAO Xiangdong, gaoxd666@126.com
  • Received Date: 2016-10-10
    Accepted Date: 2017-01-11
  • In order to monitor high-power laser welding status in real time, the method based on multi-feature fusion was put forward to predict the weld formation. Choosing the welding of 304 austenitic stainless steel plates by high power disk laser as the experimental target, the spectral distribution of laser welding was obtained by a spectrometer. A high-speed camera in ultraviolet band and visible light band was applied to capture the metal vapor visual images. Comprehensive analysis and experimental verification were conducted on the relationship between characteristic parameters and welding status. Back propagation neural network model was set up with characteristic parameters to predict the weld formation, and the average values of relative errors of weld width and penetration are 0.18mm and 0.72mm. Experimental results show that the proposed method can reflect the state change of weld width and penetration accurately and is helpful for monitoring high-power disk laser welding process in real time.
  • 加载中
  • [1]

    LIU X X, HUANG R, YAO G, et al. Numerical simulation of the temperature field of laser butt welding of titanium alloy sheet[J]. Laser Technology, 2013, 37(5):700-704(in Chinese).
    [2]

    CUI L, LI X Y, HE D Y, et al. Microstructure investigation of Nd:YAG laser welded 5A90 aluminum-lithium alloys[J]. Transactions of The China Welding Institution, 2010, 31(9):77-80(in Chinese).
    [3]

    GAO X D, SUN Y, YOU D Y, et al. Multi-sensor information fusion for monitoring disk laser welding[J]. International Journal of Advanced Manufacturing Technology, 2015, 85(5/8):1167-1175.
    [4]

    TENNER F, BROCK C, KLÄMPFL F, et al. Analysis of the correlation between plasma plume and keyhole behavior in laser metal welding for the modeling of the keyhole geometry[J]. Optics & Lasers in Engineering, 2015, 64(1):32-41.
    [5]

    GAO X D, WANG R L, LONG G F, et al. Study of characteristics of plume based on hue-saturation-intensity during high-power disk laser welding[J]. Acta Physica Sinica, 2012, 61(14):148103(in Chinese).
    [6]

    LI Zh Y. Welding plasma radiation spectrum theory and industrial application basis[M]. Beijing:Peking University Press, 2013:57-62(in Chinese).
    [7]

    GAO X D, LIU G Q. Elucidation of metallic plume and spatter characteristics based on SVM during high-power disk laser welding[J]. Plasma Science and Technology, 2015, 17(1):32-36. doi: 10.1088/1009-0630/17/1/07
    [8]

    TANG J, ZUO D, WU T, et al. Spatio-temporal evolution of laser-induced air plasma in the stage of laser pulse action[J]. Optics Communications, 2013, 289(4):114-118.
    [9]

    ZHAI Y, ZHU R H, SHEN H. Influence of laser power and incident angle as well as testing distance on laser inducted breakdown spectroscopy(LIBS) technology for spectroscopy diagnosis and multi-element analysis[J]. Spectroscopy and Spectral Analysis, 2011, 31(10):2634-2638(in Chinese).
    [10]

    ZHAO X X, LUO W F, ZHANG X W, et al. Measurement of brass plasma parameters based on laser-induced breakdown spectroscopy[J]. Laser Technology, 2013, 37(1):93-96(in Chinese).
    [11]

    DU X, YANG L J, LIU T, et al. The spectral analysis of laser-induced plasma in laser welding with various protecting conditions[J]. Spectroscopy & Spectral Analysis, 2016, 36(1):15-19(in Chinese).
    [12]

    LIU T, YANG L J, WANG L J, et al. A comparative analysis of the passive electric probe detection and spectrum diagnosis of laser-induced plasma[J]. Spectroscopy & Spectral Analysis, 2014, 34(2):289-292(in Chinese).
    [13]

    YU F, XU X. A short-term load forecasting model of natural gas based on optimized genetic algorithm and improved BP neural network[J]. Applied Energy, 2014, 134:102-113. doi: 10.1016/j.apenergy.2014.07.104
    [14]

    GUO H F, LI J L, SUN T. Roughness prediction of kerf cut with fiber laser based on BP artificial neural networks[J]. Laser Technology, 2014, 38(6):798-803(in Chinese).
    [15]

    ZHOU C, ZHANG L, CHEN G Y, et al. Prediction and optimization algorithm of process parameters for laser dressing grinding wheels[J]. Laser Technology, 2015, 39(3):320-324(in Chinese).
  • 加载中
通讯作者: 陈斌, bchen63@163.com
  • 1. 

    沈阳化工大学材料科学与工程学院 沈阳 110142

  1. 本站搜索
  2. 百度学术搜索
  3. 万方数据库搜索
  4. CNKI搜索

Figures(6) / Tables(3)

Article views(5405) PDF downloads(140) Cited by()

Proportional views

Analysis of high-power disk laser welding status based on multi-feature fusion

    Corresponding author: GAO Xiangdong, gaoxd666@126.com
  • Guangdong Provincial Key Laboratory of Computer Integrated Manufacturing, Guangdong University of Technology, Guangzhou 510006, China

Abstract: In order to monitor high-power laser welding status in real time, the method based on multi-feature fusion was put forward to predict the weld formation. Choosing the welding of 304 austenitic stainless steel plates by high power disk laser as the experimental target, the spectral distribution of laser welding was obtained by a spectrometer. A high-speed camera in ultraviolet band and visible light band was applied to capture the metal vapor visual images. Comprehensive analysis and experimental verification were conducted on the relationship between characteristic parameters and welding status. Back propagation neural network model was set up with characteristic parameters to predict the weld formation, and the average values of relative errors of weld width and penetration are 0.18mm and 0.72mm. Experimental results show that the proposed method can reflect the state change of weld width and penetration accurately and is helpful for monitoring high-power disk laser welding process in real time.

引言
  • 激光焊接是现代工业生产中的一种重要的高效精密加工技术,它具有能量密度高、热影响区小和焊缝深宽比大等特点[1-2]。在激光焊接过程中,焊件被激光束加热汽化后,在熔池上方形成高温金属蒸气[3-4]。焊接过程中光谱信号和金属蒸汽视觉信号取决于激光功率、焊件材料和焊接速度等焊接条件,在整个焊接过程中与焊接质量密切相关, 通过分析其特征量,可以实现激光焊接过程的实时监控[5-7]

    目前对光谱信号的研究主要集中在利用发射光谱或吸收光谱诊断电子温度、电子密度和化学组成成分等参量[8-9],研究激光功率、激光入射角度、测试间距和保护气体等焊接条件对电子温度和电子密度的影响[10-11], 上述研究均没有涉及结合金属蒸气视觉信息对焊接状态的实时检测。本文中,针对大功率碟片激光焊接304不锈钢板,用分光仪获取焊接过程的光谱信号,应用紫外波段和可见光波段高速摄像机采集焊接过程中金属蒸气视觉图像,处理焊接信号并提取相关特征参量,分析各个特征参量与焊接质量间的关系,建立后向传播(back propagation, BP)神经网络模型预测焊缝成形,为焊接过程的在线监控提供试验依据。

1.   试验装置
  • 试验装置包括大功率碟片激光焊接装置Trumpf-16002、松下六关节机器人、激光焊接头、保护气体(氩气)装置及图像采集系统,结构如图 1a所示。将配备有可视感应滤波器的高速彩色摄像机安装在垂直于焊接方向的位置,获取金属蒸气视觉图像。沿焊接方向前端设置分光仪准直器,聚焦位置为匙孔上方的金属蒸气区域。试验中高速摄像机的采集速度为5000frame/s,分光仪的聚焦范围设置在紫外到近红外区域,即186nm ~1100nm,曝光时间为2ms,采样频率为500Hz,激光功率为13kW,焊接速率为3m/min,激光光斑直径为200μm,聚焦位置为-3mm,激光波长为1030nm,图像分辨率为512pixel×512pixel,氩气流量为30L/min。T型焊件304不锈钢板尺寸如图 1b所示。

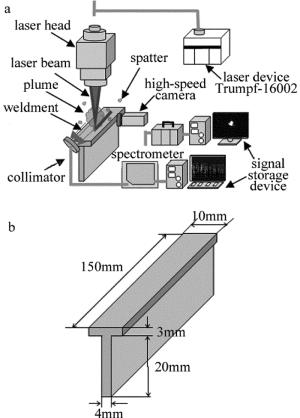
    Figure 1.  a—schematic diagram of laser welding b—diagram of weldment

2.   焊接信号特征分析
  • 焊接过程中由于具有高温、状态参量多变等原因,其性质往往需要间接测量,而光谱信号就蕴含丰富的焊接状态信息。因此,在激光焊接试验过程中,将产生的光谱信号通过准直器和光纤被分光仪接收,利用分光仪内的棱镜和光栅解析光谱分布特征,最终用计算机采集获取焊接过程光谱分布,其波长范围为400nm~900nm的谱线强度图如图 2a所示。

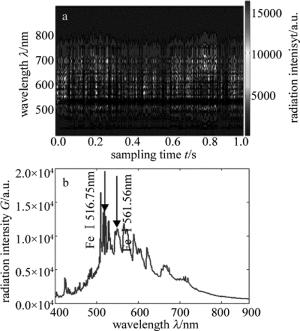
    Figure 2.  a—spectral distribution b—relationship between intensity and wavelength

    可描述的基本热力学参量有多个,其中电子温度就是重要的参量之一,且可以利用光谱诊断方法进行分析。常见的电子温度的计算方法有谱线绝对强度法、标准温度法、谱线相对强度法和玻尔兹曼图法等,本次试验中采用谱线相对强度法,其计算公式如下式所示[12]

    式中,g1g2为两能态的统计权重,A1A2为两能态的跃迁几率,λ1λ2为波长,E1E2为激发电位,I1I2为相对强度,T为电子温度。

    图 2b为谱线的强度-波长图。在对其进行分析的基础上,确定了以FeⅠ516.75nm和FeⅠ561.56nm两条特征谱线为计对象。各谱线的光谱学物理参量如表 1所示(下标i=1, 2)。计算所得电子温度曲线图如图 3a所示。获取的信号表明, 激光焊接过程的谱线主要集中在500nm~700nm,所以同时提取该段波长的平均辐射强度G作为特征参量,如图 3b所示。

    λi/nm Ei/cm-1 gi Ai/s-1
    516.75 31322.613 7 2.72×10⁶
    561.56 44677.006 9 2.64×10⁷

    Table 1.  Spectroscopy physical parameter of spectral line

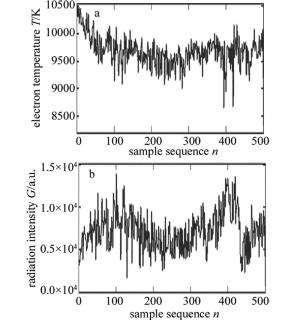
    Figure 3.  Characteristic parameters of spectral

  • 应用高速彩色摄像机摄取连续的金属蒸气图像,取其中5000帧进行特征提取,其对应的焊缝长度为50mm。将金属蒸气彩色原图转换为灰度图像,通过中值滤波去除噪声,得到形状和数量均与原图相符的二值化图像,除去飞溅点得到金属蒸气二值化图像。图 4a, 图 4b图 4c分别为不同时刻金属蒸气图像的处理过程。

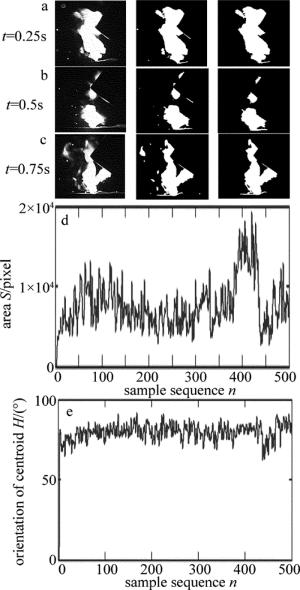
    Figure 4.  Characteristic parameters of visual images of metal vapor

    为了描述金属蒸气特征,定义并提取二值化图像序列的金属蒸气面积S和金属蒸气质心方位H(质心和焊接点的连线与水平线所成夹角)两个形状特征参量,并将每10帧图像所得特征参量值取平均值,所得结果如图 4d图 4e所示。

  • 激光功率P=13kW时,焊缝的正面、侧面实物图以及熔宽和熔深如图 5所示,其中实线表示熔宽,虚线表示熔深。对各焊接过程中获取的信号进行特征参量的计算后,发现其特征存在一定的规律性。根据各个特征参量、熔宽w和熔深k划分出3个区域,分别为A区域(100~130)、B区域(220~250)和C区域(400~430),如图 5c所示。求取各个特征参量在对应区域内的平均值,所得结果及各区域的光谱信号和视觉信号如图 6所示。

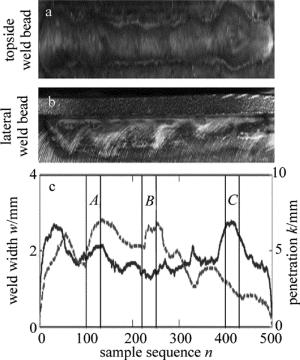
    Figure 5.  Actual parameters of weld bead

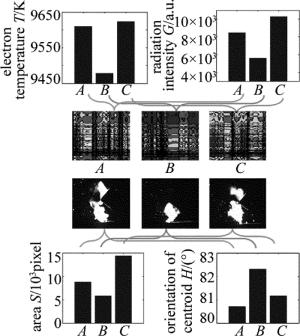
    Figure 6.  Mean values of characteristic parameters

    焊缝平均熔宽在C区域最大,A区域次之,B区域最小,而各区域的焊缝平均熔深则相反,即B>A>C。结合图 6分析可知,电子温度、辐射强度、面积与焊缝宽度反映出相同的规律,即C>A>B, 而质心方位会随着熔宽变化的增大而减小,熔宽越稳定,质心和焊接点的连线与水平线所成夹角越大。在激光功率一定的情况下,当熔宽逐渐增大,焊缝的熔深随之减小,此时,匙孔内的蒸发量增加,导致金属蒸气的面积随之增大,金属蒸气压力的提高使得金属蒸气整体前倾,质心方位随之减小,金属蒸气能量的增大也使其电子温度和强度随之增大。

    在划分区域内,各个特征参量的平均值以近似的规律反映了焊接状态,但各个曲线在不同区域内的波动大小有着明显的差异,所以,最后通过计算4个特征参量的相对波动S来观察各个区域的参量波动情况,其计算公式如下式所示:

    式中,x1, x2, …, xm为该组数据具体数值,m为各个区域数据的个数。

    特征参量数在3个区域内的相对波动计算结果如表 2所示。可以发现,TS相对波动大小排列为C>A>B,而GH的相对波动反映出的规律分别为A>C>BB>A>C,这表示当熔宽产生偏大或偏小的变化时,电子温度和面积的波动都会随之增大,且变化越大波动越大,而光谱强度波动则是随变化的增大而减小,金属蒸气的质心方位波动随熔宽的增大而减小。以上结果表明,虽然4个特征参量数值规律相似,但其波动规律不尽相同,它们以不同的方式反映了焊缝的实际焊接状态。

    region T/K G/a.u. S/pixel H/(°)
    A 231.20 1.80×10³ 1.38×10³ 18.37
    B 199.61 1.52×10³ 1.00×10³ 23.55
    C 299.24 1.37×10³ 2.26×10³ 9.64

    Table 2.  Relative fluctuation of characteristic parameters

3.   BP神经网络的预测模型
  • 后向传播神经网络即误差后向传播算法的学习过程,由信息的正向传播和误差的后向传播两个过程组成[13-14]BP神经网络的预测性能更加优越,能有效反映多因素之间的复杂关系[15]。设计一个焊缝成形BP预测模型,包含一个输入层、一个输出层和一个隐含层,以$\mathit{\boldsymbol{X}} = [P, T, G, S, H] $作为输入量,熔宽预测值W和熔深预测值K作为输出量,学习速率为0.001,最大训练次数为1000,训练精度为0.0001。为了验证提取的特征参量预测焊缝成形的有效性,另外在激光功率P=14kW时进行一组焊接试验,对采集到的光谱信号和视觉信号进行特征提取。

    将两组焊接试验的各个特征参量归一化处理得到1000组数据,并将任意900组数据作为训练集,其余的100组数据则作为测试集。为了更好地比较预测值与实际值,定义熔宽预测值W和熔深预测值K的绝对误差平均值分别如下式所示:

    式中,Wi为熔宽预测值,wi为焊缝实际宽度,Ki为熔深预测值,ki为实际熔深,N为测试集数量。焊缝成形预测绝对误差平均值e1e2表 3所示。

    average value of errors/mm number of neurons in the hidden layer
    5 6 7
    e1 0.21 0.18 0.22
    e2 0.76 0.72 0.74

    Table 3.  Predicting results of neural network

    焊缝成形预测模型的绝对误差平均值e1e2在隐含层节点数为6时得到了最小值,分别为0.18mm和0.72mm。这表示将处理得到的光谱特征参量和金属蒸气视觉特征参量作为BP神经网络的输入时,其输出能很好地逼近实际值,从而实现焊接状态的实时评估,说明试验中提取的光谱信号和金属蒸气视觉信号能准确地反映实际的焊接状态。焊缝成形预测过程中模型仅仅采用了100个的测试集,但预测结果完全符合检测要求,这表明在实际的焊接状态在线监控过程中,即使利用较低速率的摄像机采集图像,仍然能满足在线监控的实时性需求。

4.   结论
  • (1) 在大功率碟片激光焊接过程中,并用分光仪获取光谱分布,并用紫外波段和可见光波段高速摄像机采集金属蒸气视觉图像,提取相应特征参量,可直接反映焊接状态的变化。

    (2) 随着熔宽的增大,熔深逐渐减小,电子温度、辐射强度和金属蒸气面积逐渐增大,而金属蒸气质心方位会随着熔宽变化的增大而减小。

    (3) 建立BP神经网络焊缝成形预测模型,将提取的光谱信号和视觉信号特征参量作为模型输入进行焊缝成形预测,可以有效地反映焊接状态。

Reference (15)

Catalog

    /

    DownLoad:  Full-Size Img  PowerPoint
    Return
    Return