 网站地图
网站地图


-
激光引信具有抗干扰能力强、系统体积小、实时测距精度高且安全性有保证等优点,在战术导弹领域取得了普遍的应用。通常在激光回波信号里含有目标特征、反射特点等关键有用信息, 但提取目标回波特征对实验场地要求较高,回波信号中不仅存在大量杂波,激光引信也易受到自然环境如云雾、沙尘较大影响。而且由于探测目标体型较大,现场难以做到多次重复实验。国内外对激光引信回波信号仿真及抗干扰开展了大量研究,LI提出将回波信号功率峰值对应目标特征,以此实现目标回波仿真。ZHANG等人提出一种基于蒙特卡罗法的激光引信回波信号仿真技术[1]。TAN等人提出一种基于双向反射函数的水下激光引信回波仿真方法[2]。本文中根据目标的表面材料和所得双向反射分布函数(bidirectional reflectance distrbution function, BRDF)实验数据,结合遗传优化算法来进行建模[3-4],最后提出一种基于回波包络上升速率的区域联合判别方式,研究了在理想环境和云雾环境下目标的点回波特征。
-
假设坐标系(Oxmymzm)的原点在激光引信的中心,Oxm轴沿横轴并取方向为正,Oym轴垂直于Oxm轴方向向上,Ozm轴和横轴于同一平面且构成右手规则。设γ1为发射光路内倾角,Δγ1为视场成像角;γ2为接收光路内倾角,视场宽度为Δγ2[9]。其中,4组发射与接收装置共同构成激光引信,每组接收与发射装置分布均匀且距离相近。激光引信发射脉冲电流,再通过引信发射装置产生激光束,在系统的驱动下,激光束在弹轴平面形成90°的视场角,发射光束扁平,象限光学发射系统使其在目标周围被看作一个圆锥形探测视场。如图 1所示。
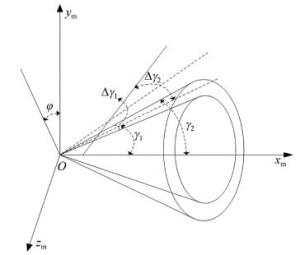
Figure 1. Schematic diagram of laser fuze emission field
-
通常理想目标表面材料的光散射特性复杂,理论上由粗糙面散射理论可获知实验数值,但实际上很难提供计算所需的粗糙面元微观特性如相关长度、统计分布等。因此,通常使用双向反射分布函数BRDF来描述目标面元的光散射特征。BRDF所描述的光散射特征分布和粗糙面元的微观特性、材料介电常数、入射光波长等因素紧密联系。通常粗糙面元会被看作是由大量微面元构成,且所有微面元的反射都遵循菲涅耳效应[10-11]。
如图 2所示,对于小面元dS,入射光源方向为(θi, φi),探测器的观测方向为(θr, φr)。其中θ是天顶角,φ是方位角,z是代表粗糙面元的法线。BRDF定义为入射到粗糙表面的光辐射照度与光辐射亮度相联系,在图中表示为dLr(θi,φi,θr,φr)与沿(θi,φi)方向入射到被照射面元的亮度dEi(θi, φi)之比,即:
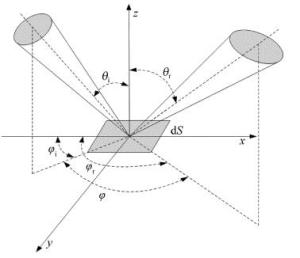
Figure 2. BRDF geometric diagram
$ {f_{\rm{r}}}\left( {{\theta _{\rm{i}}}, {\varphi _{\rm{i}}}, {\theta _{\rm{r}}}, {\varphi _{\rm{r}}}} \right) = \frac{{{\rm{d}}{L_r}\left( {{\theta _{\rm{i}}}, {\varphi _{\rm{i}}}, {\theta _{\rm{r}}}, {\varphi _{\rm{r}}}} \right)}}{{{\rm{d}}E({\theta _{\rm{i}}}, {\varphi _{\rm{i}}})}}({\rm{s}}{{\rm{r}}^{ - 1}}) $
(1) 式中, fr(θi, φi, θr, φr)可以简化为fr(θi, θr, φ),φ=φr-φi为小面元坐标系内入射角与反射角的差值。
-
根据粗糙面元的BRDF样片材料,可以获知样片表面的光散射特征。但由于直接获取样片BRDF很困难,实验次数有限,不能多次重复实验获取数据。一般情况下是采用所得到的部分BRDF实验值拟合五参量统计模型,五参量模型基于粗糙面元的目标光散射计算获得,最终给出了BRDF的五参量统计模型[12]:
$ \begin{array}{l} {f_{\rm{r}}}({\theta _{\rm{i}}}, {\theta _{\rm{r}}}, {\varphi _{\rm{r}}}) = \frac{{{k_{\rm{b}}}{k_{\rm{r}}}^2{\rm{cos}}\alpha }}{{1 + \left( {{k_{\rm{r}}}^2 - 1} \right){\rm{cos}}\alpha }}{\rm{exp}}\left[ {b \times } \right.\\ \;\;\;\;\;\;\;\;\;\;\left. {{{\left( {1 - {\rm{cos}}\gamma } \right)}^a}} \right]\frac{{G({\theta _{\rm{i}}}, {\theta _{\rm{r}}}, {\varphi _{\rm{r}}})}}{{{\rm{cos}}{\theta _{\rm{r}}}}} + {k_{\rm d}} \end{array} $
(2) 式中, kb,kd,kr,a,b为待定参量。kb为镜反射系数,kd为漫反射系数,kr为与微面元表面法线分布函数相关的参量,a和b是与表面菲涅耳函数相关的系数。根据能量守恒定律,kd+kb≤1,θi, θr, φr分别为入射角、散射角和相对方位角,γ为微观平面上本地坐标系的入射角。(2)式前半部分表示的是双向反射分布函数的相干散射,其中粗糙表面上偏振二向分布函数用kr2×cosα/[1+(kr2-1)cosα]标记,α为微面元平面法线与粗糙面元平面法线的夹角[13-14],菲涅耳反射系数用exp[b(1-cosγ)]来表示,遮蔽系数用G(θi, θr, φr)来表示。
遗传算法的收敛速度极快,它是一种全局优化概率算法,可以很快找到最佳解。而且各态历经性使其能够有效进行全局优化搜索,减少计算时间,保证算法有效性基础上得到参量值。因此可以通过遗传算法来计算五参量模型的参量值[15]。选取样片1和2的实测BRDF数据来进行优化建模,波长和五参量如表 1所示。
Table 1. Five parameters data table of sample piece
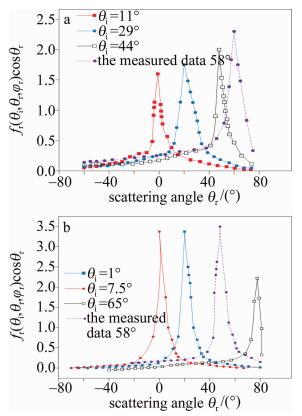
wavelength/μm kb kd kr a b error/% 0.905 1.436 0.109 26.36 0.411 -12.85 3.07 0.86 3.201 0.047 0.681 0.595 -98.04 4.71 选取不同入射波长的BRDF实测数据来进行优化建模并与实测数据相比较[16],入射波长分别为0.86μm和0.905μm。如图 3所示,实线为实测数据,虚线为五参量模型计算结果。可知对于不同材料的BRDF,目标回波的形状基本相似,幅值不同。而且随着入射角的增大,峰值功率逐渐增大。由于脉冲激光引信的探索过程是高速变化的,其入射角的波动范围值较广。因此一般检验时应选择在较大入射角的情况下进行[17-18],以便回波信号可以在能量较少时也能够成功实现检测。模拟曲线能很好地符合实验数据,证明了建模结果的正确性。
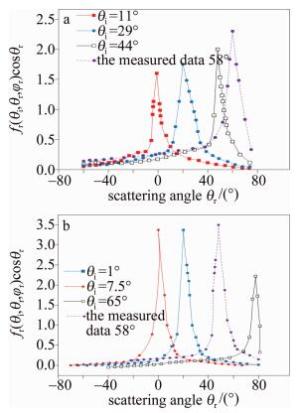
Figure 3. Schematic diagram of comparison between measured values and model values
-
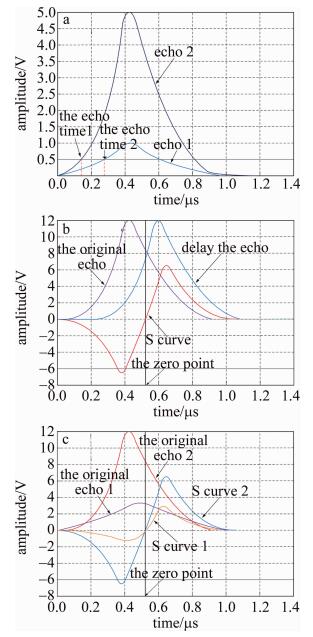
本文中系统探测装置最大测量范围为为0.1m~7m,因此对回波时刻的鉴别提出了很高的要求。激光引信回波接收系统包括光-电转换单元和回波信号处理单元。在光-电转换单元中,由于常见的回波时刻鉴别电路中需设定阈值电平,通过信号波形变换形成上升沿很陡的信号用于回波时刻判读,因此当目标反射面积变化时,由于信号幅值变化会产生较大误差,波形如图 4a所示。

Figure 4. Echo signal detection waveform
需要特别说明的是,由于系统对回波时刻的鉴别提出了很高的要求,对回波时刻判读的精度要求足够高,因此本文中采用0.1μs作为时间间隔。虽然通过双阈值前沿判定和误差补偿的固定阈值鉴别等方法能够一定程度上改善回波时刻依赖回波幅值这一问题,但也存在精确度不高等缺点[19]。因此系统采用恒定比率过零检测方法对回波时刻进行判别,与其它方法相比,其鉴别精度高,且不依赖回波信号上升幅值。当输入信号进入鉴别电路时会被分成无差异两路信号,其中一路信号的延迟时间是脉冲宽度的一半,而另一路信号则以原始幅度和相位值传输,两路信号相减得到的信号形状呈横向的S形,信号前半部分为负信号,然后过零点变成正信号。检测波形图如图 4b所示。
由于横向S形信号在通过零点位置时不会受到信号的幅度变化和外部干扰影响,因此可以把它当作脉冲时刻鉴别的一个稳定鉴别点,其检测波形如图 4c所示。
-
针对引信工作中的实际环境,如在云烟环境中,结合脉冲激光发射系统信号处理单元对目标回波的判别,提出了基于回波包络上升速率的区域联合判别方式,并通过实际的实验测试得出数据。测试实验中用表面反射率接近实体目标的白板代替,小型目标表面反射率约为0.33,大中型目标表面反射率约为0.9,具体以不同尺寸白板来区分各型号的探测目标,云烟环境用烟雾机产生的烟雾模拟。由于研究的引信探测视场呈环形,则每一路形成的探测视场角为90°。因此,设置3个测试角度,分别为中心点0°、左侧45°和右侧45°。
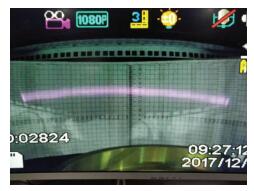
如图 5所示,通过背景板可以看到,激光光束照射的视场角以对称形式左右可分别到达45°,测试得到的光束光斑分布均匀。系统设计的小型目标作用距离为3m,中型目标作用距离为5m,大型目标作用距离为7m。在没有干扰下, 不同场景目标测试记录数据如表 2和表 3所示。
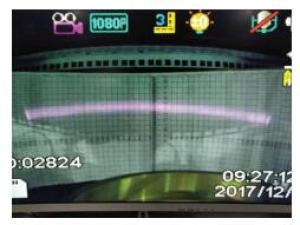
Figure 5. Laser beam diagram of emitter
Table 2. Objective test data record sheet under ideal environment
targettype range number of measurement echo signal amplitude/mV left 45° center 0° right 45° small object 3m No.1 240 460 250 No.2 260 400 270 No.3 220 280 310 medium target 5m No.1 210 300 130 No.2 150 300 110 No.3 460 600 280 large target 7m No.1 130 200 160 No.2 110 110 110 No.3 280 350 250 Table 3. Objective test data record sheet under cloud and smoke environment
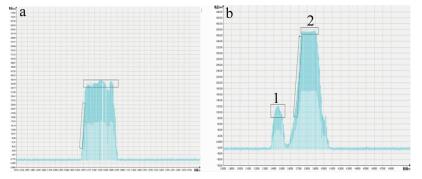
target type range number of measurement echo signal amplitude/mV left 45° center 0° right 45° small object 3m No.1 250 360 210 No.2 260 280 250 No.3 210 220 210 medium target 5m No.1 310 260 230 No.2 150 210 180 No.3 160 230 240 large target 7m No.1 200 190 180 No.2 130 130 130 No.3 130 140 130 将模拟目标白板在不同作用距离点上下移动,找到反射点,通过示波器显示反射回波,读取回波幅值。利用数据记录仪记录回波包络图如图 6a所示。
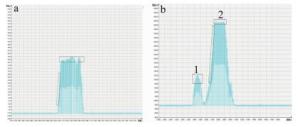
Figure 6. Echo envelope diagram under different scenarios
从记录结果可以看到, 在中心位置即发射激光直射到目标时, 发射回波的幅值最大,位于探测视场两侧的光束能量略有下降。由于作用距离变大,反射回波幅值会降低,这符合激光传输能量的变化趋势。图中矩形框内包络的上升速率呈递增趋势,到达峰值后稳定持续一段时间,包络走势满足对目标识别的判定准则。
使用烟雾机在装置探测视场内间隔喷出烟雾来模拟实际环境,测试结果如表 3所示。
在实际环境中,系统正常工作,比较表 2数据,回波幅值大小有所降低,偏差约为65.3%。这是因为激光脉冲抵抗干扰而损失能量,但在判定准则的应用下依然实现对目标的判定。利用数据记录仪记录此测试环境下的回波包络如图 6b所示。
与图 6a相比,系统探测到的回波包络图出现明显的差异,在探测光路中脉冲激光由于实际环境如云烟的影响,激光反射率较低,因此, 系统接收到此部分反射回波后作出的反应会出现小幅的的包络响应。当激光穿过云烟到达目标表面时,反射回波到达接收系统后会出现幅度较大的反应目标的包络图形。从包络图中可以明显看出, 目标形成的包络在前沿上升速率较快,且达到峰值后稳定持续一段时间。对比图中方框1和方框2可知,干扰形成的包络在达到某一峰值后会迅速下降,不会形成持续稳定得包络现象,因此, 系统在探测过程中依据判定准则较好地实现了抗干扰。
-
为了在复杂环境下提取目标回波特征信息,传统方法主要通过对目标反射回波信号的功率值来仿真,且常常忽略了云烟环境产生的干扰。本文中结合遗传算法与五参量统计模型对目标进行建模,分析比较了几种常用时刻鉴别方法,并选择了恒定比率过零检测方法,通过仿真检测回波得知该方法可以很好地判别脉冲时刻。最后提出了一种基于回波包络上升速率的区域联合判别方法,加入干扰因素后,通过对比得到了探测视场不同角度点回波幅值。该方法通过对回波包络走势的判别实现对目标的判定,且在云烟环境中实现了抗干扰,提高了回波信号仿真的精确度。由于系统的测量精度和稳定性还有进一步提升的可能,对于回波信号及其抗干扰在以后的研究工作中还需体现其多样性。
基于激光引信的回波仿真及抗干扰研究
Echo simulation and anti-jamming research based on laser fuze
-
摘要: 为了提取目标回波信号的特征信息、提高回波信号仿真精确度,采用地面验证实验时将回波数据记录下来对其数字仿真的方法,将二次曲面单元作为几何建模的基础单元来建立目标几何模型,基于目标表面的材料及双向反射分布函数实测数据,结合遗传优化算法对不同波长的样品从不同角度来进行五参量建模。采用回波包络上升速率的区域联合判别方式,对不同环境下目标的点回波幅值进行了实验验证。结果表明,电压在云烟环境与理想环境下的偏差约为65.3%,包络走势满足对目标识别的判定准则,且在云烟环境中实现了抗干扰,能够修正改善目标在云烟环境下回波信号的仿真模型,提升仿真精确度。Abstract: In order to extract the characteristic information of the target echo signal and improve the simulation accuracy of the echo signal, a digital simulation method was adopted to record the echo data in the ground verification test. Quadric surface element was used as the basic element of geometric modeling to establish the target geometric model. Based on the material of the target surface and the measured data of bidirectional reflectnace distrbution function (BRDF), five-parameter modeling was carried out for samples of different wavelength from different angles by combining genetic optimization algorithm. The amplitude of point return wave of target under different environment was verified by the method of region joint discrimination of echo envelope rising rate. The results show that the deviation between the voltage in the cloud environment and the ideal environment is about 65.3%, the enveloped trend satisfies the criterion of target recognition, and the anti-interference is realized in the cloud environment, which can modify and improve the simulation model of target echo signal in the cloud and smoke environment and improve the simulation accuracy.
-
Key words:
- laser technique /
- the signal simulation /
- BRDF /
- echo envelope /
- five parameters /
- anti-interference
-
Figure 3. Schematic diagram of comparison between measured values and model values
a—wavelength measurement chart of 0.905μm b—wavelength measurement chart of 0.86μm
Figure 4. Echo signal detection waveform
a—echo error caused by fixed threshold b—echo signal detection waveform c—waveform of amplitude change of S-type signal crossing zero loop
Figure 6. Echo envelope diagram under different scenarios
a—detection echo envelope diagram under ideal environment b—detection echo envelope diagram under cloud and smoke environment
Table 1. Five parameters data table of sample piece
wavelength/μm kb kd kr a b error/% 0.905 1.436 0.109 26.36 0.411 -12.85 3.07 0.86 3.201 0.047 0.681 0.595 -98.04 4.71  下载: 导出CSV
Table 2. Objective test data record sheet under ideal environment
targettype range number of measurement echo signal amplitude/mV left 45° center 0° right 45° small object 3m No.1 240 460 250 No.2 260 400 270 No.3 220 280 310 medium target 5m No.1 210 300 130 No.2 150 300 110 No.3 460 600 280 large target 7m No.1 130 200 160 No.2 110 110 110 No.3 280 350 250
下载: 导出CSV
Table 3. Objective test data record sheet under cloud and smoke environment
target type range number of measurement echo signal amplitude/mV left 45° center 0° right 45° small object 3m No.1 250 360 210 No.2 260 280 250 No.3 210 220 210 medium target 5m No.1 310 260 230 No.2 150 210 180 No.3 160 230 240 large target 7m No.1 200 190 180 No.2 130 130 130 No.3 130 140 130
下载: 导出CSV
-
[1] ZHANG H, WANG Y T. Simulation technology of laser fuze echo signal based on monte carlo method [J]. Journal of System Simulation, 2004, 16(8):1624-1626(in Chinese). [2] TAN Y Y, ZHANG H, ZHA B T. Simulation method of underwater laser fuze echo based on bidirectional reflection function [J]. Acta Photonica, 2016, 45(12):1207002(in Chinese). doi: 10.3788/gzxb20164512.1207002 [3] ZHANG J G, LIANG X G, TANG J. A method for calculating target echo signal of laser fuze [J]. Guidance and Fuze, 2008, 29(1):22-27(in Chinese). [4] CHEN Sh Sh, ZHANG H, XU X B, et al. Study on echo characteristics of pulsed laser fuze detection of planar targets [J]. Journal of Military Engineering, 2018, 39(6):12-15(in Chinese). [5] NIU Q P, GAO Ch. Study on target echo range image characteristics of laser fuze [J]. Computer Measurement and Control, 2013, 21(11): 128-129(in Chinese). [6] WANG B, LIN J X, TONG G D, et al. Echo simulation of complex target laser fuze [J]. Guidance and Fuze, 2012, 33(4): 24-30(in Chinese). doi: 10.4028/www.scientific.net/AMR.571.332 [7] QIAN R Ch, GUI Y N, DONG W B, et al. Variable coefficient correlation detection of laser fuze pulse echo [J]. Chinese Journal of Detection and Control, 2014, 36(5):1-5(in Chinese). [8] MA Y. Study on optimization modeling and application of BRDF on near-field target surface of laser fuze[D].Nanjiang: Nanjing University of Technology, 2015: 11-14(in Chinese). [9] WEI T F. Statistical modeling and application of BRDF optimization [D].Xi'an: University of Electronic Science and Technology, 2012: 22-26(in Chinese). [10] LI H P, LI G Y, CAI Zh J, et al. Full waveform lidar echo decomposition method [J]. Journal of Remote Sensing, 2019, 23 (1): 89-98(in Chinese). [11] LU M, KONG D H, SU Y D. Target identification method of anti-radiation missile laser fuze based on PCA [J]. Chinese Journal of Detection and Control, 2019, 41(1):15-18(in Chinese). [12] LI J, HUANG Zh. Analysis and research on echo signal processing method of laser fuze [J]. Communications Technology, 2009, 42(11):217-218(in Chinese). [13] WANG H J, GUO H J, LI J H. Optimization algorithm of ultrasonic echo signal envelop correlation delay estimation [J]. Computer Engineering and Application, 2012, 48(20):154-157(in Chinese). [14] CHENG Z, XIA M, LI W. Underwater lidar echo extraction based on variable forgetting factor RLS algorithm [J]. Advances in Laser and Optoelectronics, 2016, 53(1):32-39(in Chinese). [15] WANG T, SHEN Y H, YAO J Q. Study on de-noising of laser radar echo signal based on wavelet threshold method [J]. Laser Technology, 2019, 43(1):63-68(in Chinese). doi: 10.1016/j.optlaseng.2013.02.011 [16] YU X, MIN M, ZHANG X Y, et al. Effects of typical filters on the echo signal of satellite borne high spectral resolution lidar channel at 532nm [J]. Infrared and Laser Engineering, 2018, 47(12):122-131(in Chinese). [17] DAI C, WANG Y Q, XU F. 3-D laser radar echo decomposition based on particle swarm optimization [J]. Laser Technology, 2016, 40(2): 284-287(in Chinese). [18] CHEN H M, LIU Y, ZHU X W, et al. Simulation and analysis of echo characteristics of frequency-modulated continuous wave laser fuze [J]. Chinese Journal of Military Engineering, 2015, 36(12):2247-2253(in Chinese). [19] LING J J, LI G, ZHANG R B. Modeling and simulation of polarization spectrum BRDF[J].Spectroscopy and Spectral Analysis, 2016, 36(1):42-46(in Chinese). -

 点击查看大图

计量
- 文章访问数: 6900
- HTML全文浏览量: 5072
- PDF下载量: 18
- 被引次数: 0
