Advanced Search

ISSN1001-3806 CN51-1125/TN Map

Volume 45 Issue 1
Jan.  2021
Article Contents
Turn off MathJax

Citation:

3-D PET/MRI image fusion based on ShearLab 3D transform

  • Corresponding author: MA Zepeng, mzpdan@163.com
  • Received Date: 2020-01-06
    Accepted Date: 2020-03-06
  • In order to solve the problem that the different intensity of the same position of the 3-D positron emission tomography(PET) and the magnetic resonance imaging(MRI) image of Alzheimer's disease and retain the MRI atrophy of the cerebral cortex, cerebral sulcus, hippocampus, etc. Two images were firstly pre-processed in SPM to obtain two images. Then, using ShearLab 3D transform to process the advantages of high-dimensional data to decompose to obtain low and high-pass subbands. The high frequency subband was divided into intermediate and high frequency subband with the variance as threshold. The fusion principle of low-pass subbands was based on the method of three-dimensional extended weighted local energy and weighted sum of modified Laplacian based on 26 neighborhoods. The sharpening operator was introduced as a weight parameter to make the edge of the fused image clear. Intermediate subband enhances the edge information with absolute value activity. The high-pass subbands were combined with three three-dimensional low-level visual features to enhance the detailed features of the image. Finally, PET/MRI fusion images were obtained using ShearLab 3D inverse transform. The results show that the fusion result of ShearLab 3D transform is better than the spatial algorithm and wavelet transform as a whole. In the ShearLab 3D method, different fusion rules are compared and analyzed. The average gradient, spatial frequency, edge strength, and comprehensive entropy of the fusion result of this algorithm were improved by 11.09%, 22.58%, 152.68%, and 0.58%, respectively. It solves the problems of blurred edges and unclear details in fusion image. This study provides a reference for PET/MRI image fusion.
  • 加载中
  • [1]

    CHENG Zh Q, MA J Q. Evolution and measures of China's population ageing[J]. Academic Exchanges, 2018, 34 (12): 101-109(in Chinese).
    [2]

    GUO H J, LI Y L, WANG J. Analysis of Alzheimer's disease and Parkinson's disease burden[J]. Chronic Pathematology Journal, 2018, 19(11): 55-58(in Chinese).
    [3]

    HUANG R, HUA X S, ZHANG L, et al. Advance in imaging techniques for early diagnosis of Alzheimer's disease[J]. Chinese Journal of Rehabilitation Theory and Practice, 2017, 23(5): 534-538(in Chinese).
    [4]

    ZHENG W, SUN X Q, LI Zh. Image fusion based on shearlet transform and region characteristics[J]. Laser Technology, 2015, 39(1): 50-56(in Chinese).
    [5]

    LIU K, WANG H Q, WU M, et al. Study on fusion method of X-ray images of ancient bronze mirrors based on lifting wavelet[J]. Laser Technology, 2020, 44(1):113-118(in Chinese).
    [6]

    ZHANG J Zh, LI T, WU J. Research of medical image fusion based on wavelet transform[J]. Chinese Journal of Biomedical Engineering, 2008, 27(4): 521-525(in Chinese).
    [7]

    DO M N, VETTERLI M. The contourlet transform: An efficient directional multiresolution image representation[J]. IEEE Transactions on Image Processing, 2006, 14(12): 2091-2106.
    [8]

    SELESNICK I W, BARANIUK R G, KINGSBURY N C. The dual-tree complex wavelet transform[J]. IEEE Signal Processing Magazine, 2005, 22(6): 123-151.
    [9]

    GUO K, LABATE D. Optimally sparse multidimensional representation using shearlet[J]. SIAM Journal on Mathematical Analysis, 2007, 39(1): 298-318.
    [10]

    LABATE D, NEGI P. 3-D discrete shearlet transform and video denoising[J]. IEEE Transactions on Image Processing, 2011, 8138(3): 815-822.
    [11]

    KUTYNIOK G, LIM W Q, REISENHOFER R. ShearLab 3D: Faithful digital shearlet transforms based on compactly supported shearlets[J]. ACM Transactions on Mathematical Software, 2014, 42(1): 1-42.
    [12]

    DUAN X, WANG X G, WANG H, et al. Magnetic resonance image fusion based on three dimensional band limited shearlet transform[J]. Journal of Biomedical Engineering, 2015, 32(1): 181-186(in Chinese).
    [13]

    WANG L, LI B, TIAN L. Multimodal medical volumetric data fusion using 3-D discrete shearlet transform and global-to-local rule[J]. IEEE Transactions on Biomedical Engineering, 2014, 61(1): 197-206.
    [14]

    YANG G Ch. Research on key technologies of medical image fusion based on multi-resolution analysis[D]. Chengdu: University of Electronic Science and Technology, 2016: 89-106 (in Chinese).
    [15]

    YIN M, LIU X, LIU Y, et al. Medical image fusion with parameter-adaptive pulse nonsubsampled shearlet coupled neural network in transform domain transactions[J]. IEEE Transactions on Instrumentation & Measurement, 2019, 68(1): 49-64.
    [16]

    LIAO X. Shearlet transform domain adaptive image watermarking algorithm[J]. Application of Electronic Technique, 2010, 36(10): 137-142(in Chinese).
    [17]

    ZHU Zh Q, ZHENG M Y, QI G Q, et al. A phase congruency and local Laplacian energy based multi-modality medical image fusion method in NSCT domain[J]. IEEE Access, 2019, 7: 20811-20824.
    [18]

    KOVSEI P. Image features from phase congruency[J]. Journal of Computer Vision Research, 1999, 1(3):1-26.
    [19]

    LI H F, QIU H M, YU Zh T, et al. Infrared and visible image fusion scheme based on NSCT and low-level visual features[J]. Infrared Physics & Technology, 2016, 76: 174-184.
  • 加载中
通讯作者: 陈斌, bchen63@163.com
  • 1. 

    沈阳化工大学材料科学与工程学院 沈阳 110142

  1. 本站搜索
  2. 百度学术搜索
  3. 万方数据库搜索
  4. CNKI搜索

Figures(3) / Tables(2)

Article views(7478) PDF downloads(15) Cited by()

Proportional views

3-D PET/MRI image fusion based on ShearLab 3D transform

    Corresponding author: MA Zepeng, mzpdan@163.com
  • 1. College of Electronic Information Engineering, Hebei University, Baoding 071002, China
  • 2. Hebei Key Laboratory of Digital Medical Engineering, Baoding 071002, China
  • 3. Hebei Machine Vision Engineering Technology Research Center, Baoding 071002, China
  • 4. Affiliated Hospital of Hebei University, Baoding 071000, China

Abstract: In order to solve the problem that the different intensity of the same position of the 3-D positron emission tomography(PET) and the magnetic resonance imaging(MRI) image of Alzheimer's disease and retain the MRI atrophy of the cerebral cortex, cerebral sulcus, hippocampus, etc. Two images were firstly pre-processed in SPM to obtain two images. Then, using ShearLab 3D transform to process the advantages of high-dimensional data to decompose to obtain low and high-pass subbands. The high frequency subband was divided into intermediate and high frequency subband with the variance as threshold. The fusion principle of low-pass subbands was based on the method of three-dimensional extended weighted local energy and weighted sum of modified Laplacian based on 26 neighborhoods. The sharpening operator was introduced as a weight parameter to make the edge of the fused image clear. Intermediate subband enhances the edge information with absolute value activity. The high-pass subbands were combined with three three-dimensional low-level visual features to enhance the detailed features of the image. Finally, PET/MRI fusion images were obtained using ShearLab 3D inverse transform. The results show that the fusion result of ShearLab 3D transform is better than the spatial algorithm and wavelet transform as a whole. In the ShearLab 3D method, different fusion rules are compared and analyzed. The average gradient, spatial frequency, edge strength, and comprehensive entropy of the fusion result of this algorithm were improved by 11.09%, 22.58%, 152.68%, and 0.58%, respectively. It solves the problems of blurred edges and unclear details in fusion image. This study provides a reference for PET/MRI image fusion.

引言
  • 中国已进入老龄化阶段,预计老龄化进程在未来十几年内将不断加速[1]。阿尔茨海默病(Alzheimer disease, AD)在老年群体中发病率不断增加,并给社会、家庭带来不可估计的经济压力[2]。影像学是AD诊断的重要方式, 包括计算机断层扫描技术(computed tomography,CT)、核磁共振成像(magnetic resonance imaging, MRI)、正电子发射断层成像(positron emission tomography, PET)等,近年来PET/CT, PET/MRI两种影像结合的形式也成为重要的诊断方式[3]。其中CT检查中的X射线对活体组织有一定损伤,且对血管、神经等软组织分辨率有限。MRI的磁场与人体的水分子包含的氢原子核的旋转作用释放能量产生非常清晰的解剖结构。医生通过AD患者的MRI脑影像清晰地看到脑沟回加深加宽、脑室扩大程度、海马萎缩等,但由于很多疾病可以导致脑萎缩,仅仅依靠MRI几乎不能确诊。PET通过在人体中注射放射性物质,可以无创生理地研究人体内生物分子状态。AD患者表现为神经突触的丢失或机能的降低,PET示踪剂18氟-氟脱氧葡萄糖(18F-fluorodeoxyglucose,18F-FDG)通过葡萄糖代谢高低反映神经突触的活性,表现在皮层区域葡萄糖代谢下降,但图像空间分辨率低。因此, 采用图像融合技术生成PET/MRI图像,利用MRI清晰的结构精准判断PET葡萄糖代谢低的位置,提高AD的特异性和准确性。

    PET/MRI图像融合可在空域和变换域中实现,其中空域算法如加权平均、像素取大等原理简单、且耗时短,但忽略了纹理等信息。基于变换域的多尺度几何变换[4-5]的结果与人眼视觉效果相近被广泛使用。ZHANG等人[6]提出基于小波变换的PET和MRI图像融合,小波不能很好地表达具有方向特征的线、轮廓等,导致融合结果出现块效应。因此提出了具有更好表达方向信息的变换,如轮廓波[7]、双树小波[8]、剪切波变换[9]。由于剪切波同时具有数学表达式简单、通过一个或几个函数仿射变换产生、最佳表达高维信号的各向异性、可实现空域紧支、可扩展到3维甚至更高维的优点是其它变换不能同时拥有的,掀起了广大学者的研究热潮。LABATE等人[10-11]提出3维形式的剪切波变换。DUAN等人[12]基于3-D带限剪切波变换的磁共振图像融合,证明了3维剪切波弥补了小波变换对于方向特征的不足,但高低频所用的融合规则未顾及到体素点所在位置结构特征。WANG等人[13]基于3-D剪切波变换分解并用广义高斯密度建模,不同子带间的相关性用相对熵统计,产生较大的冗余运行速度较慢。YANG[14]基于3维医学图像体素点的物理特性和3-D剪切波融合,但是未顾及低频子带中的细节信息,使融合结果缺少细节特征。

    为此, 本文中充分考虑PET和MRI图像的结构特征和相同位置强度差异较大问题,提出了一种新的PET/MRI医学图像融合方法。采用ShearLab 3D将PET和MRI图像分解,并以方差为阈值获得高频子带中的强边缘子带,融合规则充分考虑到3维体素的空间位置信息,将低中高频融合规则由2维扩展到3维形式。低频子带以锐化矩阵增强图像边缘信息,并以3维扩展的加权局部能量与拉普拉斯算子加权和保留图像能量和细节信息。中频子带以绝对值为活动度量捕捉边缘信息。高频子带结合3维扩展的3个底层特征加权增强图像的细节特征提高融合图像亮度和对比度。结果表明,与空域算法、小波变换、不同的融合规则相比本文中的算法融合图像边缘清晰、细节丰富符合人眼视觉效果,更适用于PET/MRI图像融合。

1.   ShearLab 3D理论
  • 3-D剪切波系统是由各向异性膨胀矩阵和剪切矩阵组成[10],它们分别控制尺度和不同尺度的方向,设各向异性膨胀矩阵为:

    剪切矩阵为:

    式中, jZ为尺度参量,α∈(0, 2)为各向异性程度,k=(k1, k2)∈Z2为剪切方向,Z为整数集。移位采样晶格为下式:

    式中,c1>0, c2>0为平移量。

    对于ϕψ, $\widetilde \psi $, $\mathord{\buildrel{\lower3pt\hbox{$\scriptscriptstyle\smile$}} \over \psi }$∈L2(R2), 其中ϕ为剪切波尺度函数,ψ, $\widetilde \psi $,$\mathord{\buildrel{\lower3pt\hbox{$\scriptscriptstyle\smile$}} \over \psi }$为剪切波函数,R表示实数集,L2(R2)表示实数域R上2维均方可积函数集合,对每一个尺度j, 有α=(αj)jαj∈(0, 2),且c=(c1, c2)∈(R+)2R+为正实数,m为位置参量,通用剪切系统SH(ϕ, ψ, $\widetilde \psi $, $\mathord{\buildrel{\lower3pt\hbox{$\scriptscriptstyle\smile$}} \over \psi }$; α, c)被定义为:

    式中,

    对于ShearLab 3D中$\widehat \psi $(ξ)是一种不可分剪切波[11],在L2(R2)空间是一个紧支撑的剪切波框架, 能最优表达高维数据的空间特征其生成函数为:

    式中,函数ϕ1ψ1是紧密支持的函数,2维扇形滤波函数P都满足一定条件[11]

2.   PET/MRI图像融合
  • 首先从ADNI(Alzheimer’s Disease Neuroimaging Initiative)数据库中下载AD患者的PET和MRI脑功能影像,分别在统计参量图(statistical parametric mapping, SPM)中对源图像经过头动校正、配准、归一化处理得到两个待处理对象图像A, B。然后利用ShearLab 3D分解分别得到低频子带Cl, A(x, y, z)和Cl, B(x, y, z)高频子带Ch, 0, A(x, y, z),Ch, 0, B(x, y, z), 其中高频子带以方差为阈值获得强边缘子带为中频子带Cm, A(x, y, z)和留下的高频子带Ch, 1, A(x, y, z), Ch, 1, B(x, y, z)。本文中提出将低中高频融合规则扩展为3维,以加权局部能量与拉普拉斯算子加权和融合低频系数并以锐化矩阵作为权重参量捕捉图像中灰度跳变区域,以绝对值为活动度量融合中频子带,以3个3维扩展的底层特征加权融合高频系数。最后,经过ShearLab 3D逆变换得到融合结果PET/ MRI图像F,流程如图 1所示。

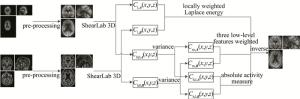
    Figure 1.  PET/MRI image fusion flowchart

  • ShearLab 3D分解生成的低频子带不但包含图像绝大多数的能量,也含有图像的纹理特征。因此低频子带融合规则的选择会影响融合结果的好坏,常用的加权平均法使融合结果轮廓不完整清晰、对比度降低。像素取大法的融合结果中MRI图像的脑沟回等细节特征不足。

    本文中考虑到每个体素点的空间信息将2维局部拉普拉斯能量加权[15]扩展到3维形式。设EWLE, s(x, y, z)为低频子带位置(x, y, z)的加权局部能量(weight local energy,WLE),s∈{A, B}分别表示待融合的PET和MRI图像。为了突出了MRI图像边缘信息,本文中将W设置为(2r+1)×(2r+1)×(2r+1)的锐化矩阵,rW的半径,即:

    r=1,W为3×3×3的矩阵,是以拉普拉斯变形模板M为基础,考虑到系数之间的相关性并以中心点到邻域的欧式距离为依据,将矩阵W的系数中距离为1的设置为-2,将距离为$\sqrt 2 $的设置为1,矩阵系数中心选取锐化程度居中的-4。

    LWSTML, s(x, y, z)是低频子带位置(x, y, z)处二十六邻域的改进拉普拉斯算子的加权和(weight sum of twenty six-neighborhood based modified laplacian,WSTML)。LTML, s[15]为改进的拉普拉斯算子(twenty six-neighborhood based modified laplacian,TML),将相邻点的权重设为欧氏距离。为了充分利用相邻体素间的关系, 将LTML, s扩展到3维,即:

    式中, iqe都为整数且不能同时为0;s, W, r同上。

    位置(x, y, z)的低频融合系数Fl(x, y, z)为下式,选取局部拉普拉斯能量大的系数为融合图像的低频系数:

  • ShearLab 3D分解后高频子带包含图像的边缘和纹理结构,为了更好地融合图像的边缘信息在高频子带中提取包含源图像强边缘信息中频子带。由于方差可以判断图像的纹理、边缘、平滑区域,其中纹理区方差最大,边缘次之,平滑最小[16]。因此以方差为阈值得到中频子带,且方差的选取与图像特点有关。

    μs与$\overline {{C_{{\rm{h}}, 0, \mathit{\boldsymbol{s}}}}} $分别ShearLab 3D分解后高频子带的方差和均值,s∈{A, B},m×n×p为高频子带图像大小。根据PET图像边缘模糊和MRI图像结构清晰边缘分界明显的特点,并通过大量实验手动设置阈值范围得到融合图像的客观评价指标,最终选取主客观评价最优的阈值0.03 < μA < 0.04,0.2 < μB < 0.3。

    中频子带采取基于绝对值的活动度量[17]保留中频子带中的边缘信息,并充分考虑到空间结构信息将其扩展到3维情况。

    Cm, A(x, y, z)与Cm, B(x, y, z)为PET, MRI图像的中频子带,以下式二值化处理:

    式中, G(x, y, z)为二值化矩阵,当PET图像的中频子带系数绝对值大于MRI图像的中频子带系数绝对值时, G(x, y, z)=1,否则为0。

    d(x, y, z)为中频子带融合的决策图,g(x, y, z)为活动指标,通过以下等式计算:

    式中, Ω是以(x, y, z)为中心的M×N×P的滑动窗口。

    中频子带的融合系数为Fm(x, y, z),当决策图d(x, y, z)=1时, PET图像的中频系数为融合图像的中频子带系数。

  • 高频子带包含了MRI源图像脑沟回等细节特征,对AD病情的诊断非常重要。因此高频子带融合规则应有效的保留细节信息,局部相位一致的大部分特征为边缘状和角状特征[18]。局部对比度、局部能量可以反映对比度和亮度信息。本文中采取这3种底层特征加权[19]的融合规则,考虑到每个体素点的空间信息将其扩展到3维形式。

    PPC, s(x, y, z)为高频子带(x, y, z)处的相位一致(phase congruency,PC)的点,s∈(A, B),即:

    式中, θkk的方向角,An, θk为第n个傅里叶分量的幅值和角度,ε=0.001是正数去除图像中的DC分量,Eθk(x, y, z)可见参考文献[19]。

    SLSCM, s(x, y, z)为(x, y, z)处的局部对比度(local measure of sharpness change, LSCM),(2M+1)×(2N+1)×(2P+1)是邻域大小,SSCM, s(x, y, z)为高频子带(x, y, z)处的对比度(measure of sharpness change, SCM)的值。

    式中, 取M=N=P=1,Ω0是(x, y, z)的3×3×3的局部区域,(x0, y0, z0)表示Ω0内的体素点。

    ELE, s(x, y, z)为高频子带(x, y, z)处的局部能量(local energy, LE),且M=N=P=1。

    用计算出来的PPC, sSLSCM, sELE, s组成活跃度测量Ns; α1β1γ1是用来调整PPC, sSLSCM, sELE, s的参量,分别为1, 2, 2[19] :

    d(x, y, z)为高频子带融合的决策图,通过(18)式计算,其中g(x, y, z)由等下式计算:

    式中, Ω1是以(x, y, z)为中心的M×N的滑动窗口。

    高频子带的融合系数Fh(x, y, z)与(20)式相同,当决策图d(x, y, z)=1时, PET图像系数为融合图像的高频系数。

3.   实验结果与分析
  • 本文中所有实验均采用Window 8操作系统,使用MATLAB 2018a平台进行仿真实验, 且PET和MRI数据均为同一AD患者同一时期的脑影像。首先在空域和变换域中采取相同的融合规则进行比较,然后在ShearLab 3D域中将本文中的融合规则与现有的PET/MRI算法[17]进行比较。选取信息熵(entropy, IE)、平均梯度(average gradient, AG)、空间频率(spatial frequency, SF)、边缘强度(edge intensity, EI)、综合熵(comprehensive entropy, CE)作为客观评价标准, 它们的值越大融合效果越好。

  • 为了验证ShearLab 3D相较于空域算法和其它变换域算法的优越性,在加权平均、像素取大、小波域和ShearLab 3D域内融合PET/MRI图像,其中小波域和ShearLab 3D域低频系数使用加权平均法,高频子带系数使用体素绝对值取大法,且都为一层分解。图 2所示为PET和MRI图像和不同算法产生的结果图像。图 2a是AD患者注射18F-FDG的PET图像,其中左上是冠状面,右上是矢状面,左下是轴状面; 图 2b表示AD患者MRI脑图像; 图 2c是空域加权平均结果; 图 2d为空域像素取大结果; 图 2e为变换域小波变换结果; 图 2f为变换域ShearLab 3D的融合结果。

    Figure 2.  PET/MRI images in different domains

    从主观角度分析,空域的加权平均相对于其它方法融合图像对比度略有降低导致边缘轮廓模糊。像素取大法由于PET和MRI呈现原理不同导致融合结果丢失MRI图像纹理信息,变换域的小波变换融合图像的边缘轮廓纹理等信息都受到了块效应的影响。ShearLab 3D融合图像从很大程度上弥补了它们的不足,可以观察到脑萎缩程度及相应组织的代谢情况。

    从客观角度分析,观察表 1图 2c图 2e,其各项评价指标数值普遍较低,尤其是图 2c中的AG, EI, SF指数过低,表示融合图像纹理特征不够清晰,灰度变化率低对比度差。图 2e中IE和CE较低融合图像信息丢失严重。图 2d中的IE, EI, CE都较好,但融合图像中只含有极少部分MRI图像的细节纹理,缺乏实用性。图 2f的AG最好,其它指标与最优相比相差甚少,相对于其它算法,ShearLab 3D轮廓清晰、细节明显更具有实用性。

    image IE AG SF EI CE
    Fig. 2c 6.5714 6.1994 16.3993 60.5671 7.1154
    Fig. 2d 6.9897 9.0842 26.4005 87.3432 7.2353
    Fig. 2e 6.1749 7.4962 27.3885 64.0184 6.7275
    Fig. 2f 6.7074 9.1187 26.8547 84.4257 6.7975

    Table 1.  Objective evaluation of PET/MRI images in different domains

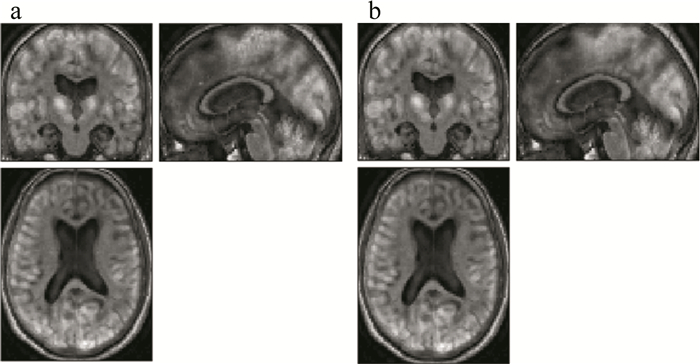
  • 在ShearLab 3D域将本文中提出的融合规则与参考文献[17]中提出的PET/MRI的融合规则进行对比。ShearLab 3D为一层分解,图 3a是参考文献[17]中融合规则的结果,图 3b是本文中融合算法结果。从视觉角度看, 两幅图像均保留了原图像的主要信息,但是图 3a中的脑沟回处边缘轮廓不明显且对比度较低,无法判断脑萎缩状况,降低了医疗诊断的实用性。本文中算法在脑沟回处边缘轮清晰,并准确地判断海马体葡萄糖代谢降低萎缩严重,右侧额叶与右侧颞叶葡萄糖代谢降低发生病变。

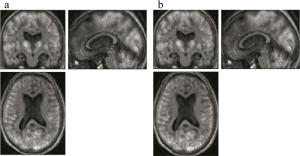
    Figure 3.  PET/MRI images with different fusion rules in ShearLab 3D domain a—reference [17] fusion results b—algorithm fusion results in this paper

    从客观指标分析观察表 2,本文中算法融合结果的IE值略低于参考文献[17]中的算法,但SF, AG, CE的评价指数都高于对比算法且EI有明显提高,表明融合结果的体素活跃程度高,对微小细节的表示度高,图像清晰。综合主客观评价, 本文中算法的融合结果边缘纹理特征丰富,清晰水平更好。

    image IE AG SF EI CE
    Fig. 3a 7.0762 10.5754 29.5454 101.2882 7.0541
    Fig. 3b 7.0280 10.6863 29.7712 102.8150 7.0599

    Table 2.  Objective evaluation of PET/MRI images with different fusion rules in ShearLab 3D domain

4.   结论
  • 针对医学图像融合要求融合图像含有丰富清晰的纹理信息准确的判断病灶,本文中基于ShearLab 3D的方向敏感对图像进行分解,并根据方差识别强边缘特征的特点将高频子带分为中高频子带。低中高频子带的融合规则由2维扩展到3维,低频子带采用加权局部能量与拉普拉斯算子加权融合规则,并以锐化矩阵作为权重参量,改善了融合结果轮廓模糊的问题。中频子带以绝对值为活动度量增强融合图像的边缘信息。高频子带结合局部相位一致性、局部对比度、局部能量3个低层特征加权的融合规则,增强图像的细节特征且增加了融合结果的亮度和对比度。通过实验结果证明,ShearLab 3D相对于空域和小波相比处理高维数据更有优势;相对融合规则,本文中提出的算法仅有信息熵略低,其它指标都高于对比算法,其中平均梯度和边缘强度表明, 本文中融合结果含有更丰富且清晰的轮廓和纹理特征,空间频率和综合熵表明, 融合图像整体活跃度和融合质量更高符合人类视觉效果。

Reference (19)

Catalog

    /

    DownLoad:  Full-Size Img  PowerPoint
    Return
    Return