Advanced Search

ISSN1001-3806 CN51-1125/TN Map

Volume 44 Issue 6
Nov.  2020
Article Contents
Turn off MathJax

Citation:

Rapid XRF test of cigarette ash based on multivariate statistical analysis

  • Corresponding author: JIANG Hong, jiangh2001@163.com
  • Received Date: 2019-12-23
    Accepted Date: 2020-02-25
  • Cigarette ash is an important material evidence at the scene of the case. In order to achieve the purpose of rapid non-destructive detection of cigarette ash, 83 collected cigarette ash samples were theoretically analyzed and then tested by energy dispersive X-ray fluorescence spectrometer. A classification model of cigarette ash based on chemometrics was established. First of all, cluster analysis was used to distinguish samples, and the accuracy of clustering results was tested by regression analysis. Then, the material elements were used as variables and the discriminant classification model was established by discriminant analysis. The results show that the clustering results are good, and the regression analysis shows that the cluster analysis categories and elements can establish a good fitting relationship. The accuracy of the classification model obtained by the discriminant analysis is 100%. If you want to classify the unknown cigarette ash samples, you only need to input the relevant variables of the discriminant model, which will show its location in the discriminant distribution map, and then you can classify the samples. This method is simple, fast, accurate and reliable. This study provides a reference for the actual handling of cases at the grassroots of public security.
  • 加载中
  • [1]

    YANG M N, JIANG H, ZHONG Y. Study on the neutron activation analysis of cigarette evidence[J].Guangdong Public Security Technology, 2017, 25(2):12-17(in Chinese). doi: 10.1007/BF02520575
    [2]

    JIANG H.Evidence examination of cigarettes[M].Beijing:Chinese People Public Security Official University Publishing House, 2018:201-202(in Chinese).
    [3]

    FU J Z, JIANG H, CHEN Y T, et al.A study on test of tipping paper with Fourier transform infrared spectroscopy[J].China Pulp & Paper, 2017, 38(20):43-48(in Chinese).
    [4]

    FU J Z, JIANG H, LI X R, et al.A study on discrimination of cigarette tipping paper by SEM/EDS[J].Heilongjiang Pulp & Paper, 2017, 45(3):10-19(in Chinese).
    [5]

    MA Sh N, WANG J M, FENG Y J, et al.Improvement of pretreatment method for determination of metal elements in cigarette ash by atomic absorption spectrometry[J].Journal of Light Industry, 2019, 34(5):32-39(in Chinese).
    [6]

    CUI D S, LIU X X.Icp-ms determined 39 elements in cigarette, ash and filter tip of a brand and preliminarily quantified the amount of elements consumed by smokers[J].Studies of Trace Elements and Health, 2009, 26(4):53-54(in Chinese). doi: 10.1176/appi.ajp.161.3.573
    [7]

    PEREZBERNAL J L, AMIGO J M, FERNANDEZTORRES R, et al.Trace-metal distribution of cigarette ashes as marker of tobacco brands[J].Forensic Science International, 2011(1):119-125.
    [8]

    HAN J T.Quantitative analysis for metallic elements in tobacco based on LIBS technique[D].Lanzhou: Northwest Normal University, 2012: 3(in Chinese).
    [9]

    ZHAO L, CHEN X Y, LI F C, et al.A preliminary study of mineral components of Chinese-produced cigarettes[J].Acta Petrologica et Mineralogica, 2009, 28(2):135-140(in Chinese).
    [10]

    GARG A N, SINGH V, CHUTKT N L, et al.Trace element characteristics of Indian cigarette tobacco by instrumental neutron activation analysis[J].Journal of Radioanalytical & Nuclear Chemistry, 1995, 195(1):161-172. doi: 10.1007/BF02036486
    [11]

    WU Q H, LI J, ZHANG Z Y.Discrimination of cigarette ash by SEM/EDS[J].Chinese Journal of Forensic Sciences, 2018, 19(1):76-81(in Chinese).
    [12]

    MA X, JIANG H, YANG J Q.Examination of plastic pack belts(ropes) via X-ray fluorescence spectrometry combined with multivariate statistical analysis[J].Laser & Optoelectronics Progress, 2019, 56(22):223005(in Chinese).
    [13]

    SAPKOTA Y, MCDONALD L M, GRIGGS T C, et al. Portable X-ray fluorescence spectroscopy for rapid and cost-effective determination of elemental composition of ground forage[J]. Frontiers in Plant Science, 2019, 10(5):317.
    [14]

    GAO J, SHENG C, SHEN R X, et al.Determination of inorganic elements in particulate matter by wavelength dispersive X-ray fluore-scence spectrometry[J].Chinese Journal of Analysis Laboratory, 2018, 37(7):809-812(in Chinese).
    [15]

    LIU W.Experimental study on fluorescent X-ray spectrum analysis for ferruginous marl[J].Journal of Anhui University of Technology(Natural Science Edition), 2012, 29(1):45-48(in Chinese).
    [16]

    WANG L, ZHANG J Q, HUA B.Determination of Zn, Al, Mg, Si, Fe, Ti, Ca, Zr and Ce components in zinc aluminum magnesium alloy by X ray fluorescence spectrometry[J].Chinese Journal of Analysis Laboratory, 2017, 36(6):738-741(in Chinese).
    [17]

    HE X L, WANG J F, HE Y, et al.Infrared spectroscopy identification of plastic steel windows based on Bayes discrimination analysis[J].Laser Journal, 2019, 40(11):33-37(in Chinese).
    [18]

    MURUGAN R, RAMASAMY T. Mutated k-means algorithm for dynamic clustering to perform effective and intelligent broadcasting in medical surveillance using selective reliable broadcast protocol in VANET[J]. Computer Communications, 2020, 150(1):563-568. doi: 10.1016/j.eswa.2014.01.021
    [19]

    YAN Q Y. Model-free tests for series correlation in multivariate linear regression[J]. Journal of Statistical Planning and Inference, 2020, 206(3):179-195.
    [20]

    LIU M, WANG Y Y.Exploring in durbin-watson autocorrelation test[J].The Journal of Quantitative & Technical Economics, 2014, 31(6):153-160(in Chinese).
    [21]

    HE X L, WANG J F, YU J Y, et al.Identification Raman spectroscopy of vehicle bumpers based on discrimination analysis[J].Laser Journal, 2019, 40(10):21-25(in Chinese).
    [22]

    GONG Y W, NIU J J.A hierarchical model of college students' physical health comprehensive evaluation was constructed based on Fisher's discriminant method[J].Contemporary Sports Technology, 2019, 9(30):143-144(in Chinese). doi: 10.1021/jp512930d
    [23]

    CHEN Y T, JIANG H.A method of discriminating cigarette inner li-ner by SEM/EDX[J].Heilongjiang Pulp & Paper, 2017, 45(4):9-22(in Chinese).
    [24]

    HE X L, WANG J F.The identification about the automotive bumper based on Newton interpolation polynomial-Infrared derivative spectroscopy[J/OL].(2019-11-06)[2019-12-27].http://kns.cnki.net/kcms/detail/51.1125.TN.20191106.1008.002.html(in Ch-inese).
  • 加载中
通讯作者: 陈斌, bchen63@163.com
  • 1. 

    沈阳化工大学材料科学与工程学院 沈阳 110142

  1. 本站搜索
  2. 百度学术搜索
  3. 万方数据库搜索
  4. CNKI搜索

Figures(4) / Tables(7)

Article views(5887) PDF downloads(14) Cited by()

Proportional views

Rapid XRF test of cigarette ash based on multivariate statistical analysis

    Corresponding author: JIANG Hong, jiangh2001@163.com
  • 1. Institute of Criminal Investigation, People's Public Security University of China, Beijing 100038, China
  • 2. Beijing Huayi Honrizon Technology Co.Ltd., Beijing 100123, China

Abstract: Cigarette ash is an important material evidence at the scene of the case. In order to achieve the purpose of rapid non-destructive detection of cigarette ash, 83 collected cigarette ash samples were theoretically analyzed and then tested by energy dispersive X-ray fluorescence spectrometer. A classification model of cigarette ash based on chemometrics was established. First of all, cluster analysis was used to distinguish samples, and the accuracy of clustering results was tested by regression analysis. Then, the material elements were used as variables and the discriminant classification model was established by discriminant analysis. The results show that the clustering results are good, and the regression analysis shows that the cluster analysis categories and elements can establish a good fitting relationship. The accuracy of the classification model obtained by the discriminant analysis is 100%. If you want to classify the unknown cigarette ash samples, you only need to input the relevant variables of the discriminant model, which will show its location in the discriminant distribution map, and then you can classify the samples. This method is simple, fast, accurate and reliable. This study provides a reference for the actual handling of cases at the grassroots of public security.

引言
  • 随着烟民数量逐年增多,烟草消耗量越来越大,香烟的种类日益增多[1],在各类案件现场经常能提取到香烟烟灰物证。通过对提取到的烟灰物证进行检验,运用多元统计方法建立分析模型,可以对香烟烟灰物证进行快速识别[2]。香烟物证是法庭科学研究的重点问题,笔者已对香烟水松纸做过系统地研究[3-4]。MA等人[5]利用原子吸收法测定了卷烟烟灰中金属元素,提出了先进行灰化再微波消解的干湿结合前处理方法。CUI等人[6]采用电感耦合等离子体质谱法(inductively coupled plasma mass sprctrometry,ICP-MS)对香烟中的微量元素进行了准确测定。PÉREZBERNAL等人[7]利用电感耦合等离子体原子发射光谱法研究了14种微量元素在不同品牌香烟烟灰中的分布情况。HAN[8]利用激光诱导击穿光谱技术测量了烟草和烟灰中一些金属元素的含量。ZHAO等人[9]利用X射线衍射法对28种国产香烟烟灰中矿物成分进行了研究。GARG等人[10]采用中子活化分析法对香烟烟灰中微量元素进行了检验。WU等人[11]利用扫描电镜/能谱法对25个不同的香烟烟灰样品进行了分析,结果表明同一品牌不同档次、同一厂家不同品牌的香烟灰样品中的元素种类和相对百分含量存在明显差异。上述方法中,有的仪器设备价格昂贵,样品制备复杂,最佳操作条件遴选过程周期较长、灵敏度较低。而X射线荧光光谱法具有分析时间短、分析元素广、工作曲线线性范围宽、对检材无损且光谱干扰少等优点,被广泛应用于冶金、化工等行业[12-16]

    本实验中采用手持式能量色散型X射线荧光光谱仪对收集到的83个不同品牌、同一品牌不同系列的香烟烟灰样品进行检验,结合系统聚类的方法对样品准确分类,并通过回归分析及判别分析法验证其准确性。取得了良好的实验效果,可为案件现场香烟烟灰物证快检提供借鉴。

1.   实验
  • OXFORD X-MET7500型荧光光谱仪(OXFORD公司);Poly-MHP透射膜、样品盒;Rh为阳极靶,电压为40kV,电流为50mA,测试时间为90s。

  • 不同品牌、同一品牌不同系列的香烟烟灰样本83个, 见表 1

    serial number sample name and series
    1# Huanghelou (yellow hard box)
    2# Huanghelou (snow view two)
    3# Huanghelou (xueya serial)
    4# Nanjing (twelve hairpins in Jinling)
    5# Lanzhou (luck filter)
    6# Hongta Mountain (classic 1956)
    7# Changbai Mountain (red hard box)
    8# Changbai Mountain (yellow hard box)
    9# Zhongnanhai Five (white hard box)
    10# Seven Wolves (white hard box)
    11# Baisha(blue hard box)
    12# Taishan Xinyue (white hard box)
    13# Golden Leaves (rose gold hard box)
    14# Cloud(red hard box)
    15# Cloud(red soft box)
    16# Huanghelou(golden blue soft box)
    17# Huanghelou(red soft box)
    18# Red Double Happiness (gold soft box)
    19# International Double Happiness (red soft box)
    20# Memory Huangshan (yellow soft box)
    21# Yuxi(soft box)
    22# Great Hall of the People (guci box)
    23# Huanghelou(blue soft box)
    24# Liqun (gray hard box)
    25# Lanzhou(blue hard box)
    26# Baisha(red hard box)
    27# Furongwang(gold hard box)
    28# Gui(golden hard box)
    29# Changbai Mountain(777 box)
    30# Pride(white hard box)
    31# Golden Bridge(Golden hard box)
    32# Cloud Hulunbuir (green and yellow hard box)
    33# Nanjing(mengdu)
    34# Nanjing(xuanhemen)
    35# Nanjing(red hard box)
    36# Great Hall of People(red hard box)
    37# Zhonghua(red hard box)
    38# Zhonghua(red soft box)
    39# Lanzhou(purple hard box)
    40# Lanzhou(luck filter)
    41# ESSE(blue hard box)
    42# ENNE(white packaging)
    43# Dubao(white soft box)
    44# Huangshan(jimei)
    45# Huangshan Red Square Seal(red soft box)
    46# Red River Panda(red soft box)
    47# Peony (red soft box)
    48# Suyan(red soft box)
    49# Yuxi(hard box)
    50# Hongta Mountain(classic 100)
    51# Red Double Happiness(shangpai)
    52# Zhonghua(full open)
    53# Zhonghua(export)
    54# Great Hall of the People(legend)
    55# Great Hall of the People(shengjing)
    56# Red Golden Dragon(red soft box)
    57# Honghe(red and white hard box)
    58# Marlboro(blue hard box)
    59# Changbai Mountain(lanshang)
    60# Marlboro(gray hard box)
    61# Huangshan Red Square Seal(yellow hard box)
    62# Panda(orange hard box)
    63# Seven Stars(white hard box)
    64# Jianpai HD Silver 4(white hard box)
    65# Furongwang(yellow hard box)
    66# Panda(jiaozi)
    67# Seven Stars(black mark)
    68# Zhongnanhai(menthol flavor)
    69# KOOL
    70# Suyan(fuyun)
    71# Hongtashan(classic 150)
    72# Hongtashan(century)
    73# Taishan(soft box)
    74# Nanjing(xiqing)
    75# Baisha(boutique cigarette)
    76# Red double Happiness (hepai)
    77# Red double Happiness (jiangshan)
    78# Nanjing(red hard box)
    79# Zhonghua(red soft box 330)
    80# China Red
    81# Taishan(yellow hard box)
    82# Changbai Mountain(hailan)
    83# Dougle Happiness

    Table 1.  Sample table of cigarette ash

  • 将收集到的烟灰样品装入样品盒内,用Poly-MHP透射膜将装有烟灰的样品盒上端封住,在上述实验条件下进行检测。借助SPSS24.0软件,Zscore标准化处理数据[17]。利用数理统计方法,对样品进行分析。

2.   分析与讨论
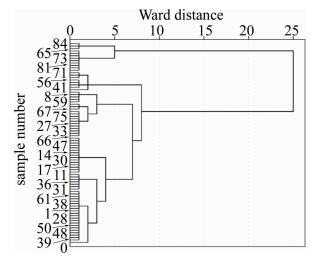
  • 按照相似性将物理或抽象对象分类,各个类别由类似对象组成,这一过程称为聚类。聚类分析是按照一定的相似性对样品分类后,通过分析发现全局数据的分布模式及样品之间的相互关系[18]。现将样品数据进行标准化处理,然后采用Ward法作为类间亲疏程度的度量方法,平方欧氏距离作为个体间距离的计算方式。样品经过聚类分析后的分类结果见图 1

    Figure 1.  Dendrogram of cluster results

    图 1所示,为了不使样品分类类别过多,同时达到聚类分析的目的,取重新标定距离为5,所有样品被分为4类(见表 2)。

    classification sample number
    70#, 74#, 65#, 77#, 78#, 73#, 79#, 76#, 81#, 68#, 80#, 71#
    18#, 63#, 56#, 60#, 64#, 41#, 53#, 58#
    8#, 29#, 7#, 59#, 82#, 51#, 67#, 69#, 72#, 75#, 40#, 83#, 27#, 34#, 37#, 33#, 2#, 42#, 66#
    3#, 16#, 47#, 12#, 24#, 14#, 25#, 5#, 30#, 15#, 45#, 17#, 19#, 22#, 11#, 4#, 13#, 36#, 55#, 54#, 31#, 32#, 10#, 61#, 9#, 43#, 38#, 52#, 23#, 1#, 21#, 49#, 28#, 46#, 6#, 50#, 35#, 44#, 48#, 20#, 26#, 39#, 57#, 62#

    Table 2.  Classification results of tobacco ash samples

  • 为了考察聚类结果的准确性,借助多元线性回归分析考察聚类结果分成的不同类别与各个元素变量之间的相互依赖的关系。回归分析是研究变量之间相关关系的一种统计方法,运用十分广泛,这种技术通常用于预测分析[19]。回归模型的相关参量方差分析结果见表 3。回归模型的分析结果见表 4。残差直方图见图 2。标准化残差预期累积概率-累积目标概率图见图 3

    model sum of squares degree of freedom mean square jointhypothesestset signification
    1 regression 78.147 14 5.582 18.867 0.000
    residual 20.118 68 0.296
    total 98.265 82

    Table 3.  Analysis of variance results

    model R R2 adjusted R2 error of standard estimation Durbin-Watson
    1 0.892 0.795 0.793 0.544 2.010

    Table 4.  Model summary

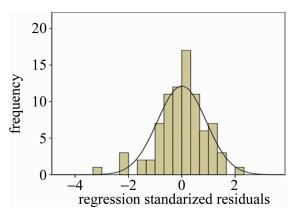
    Figure 2.  Histogram of residuals

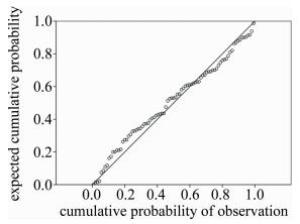
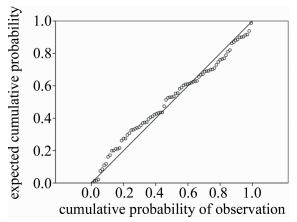
    Figure 3.  Expected cumulative probability-cumulative probability of observation of standardized residual

    表 3可知,回归模型的显著性水平为0.000(预测变量:常数、铅、铁、钴、钾、钛、锆、锌、铜、钙、汞、锰、钡、铷、锶),其显著性概率远远小于0.01,故说明该模型内各个元素变量对类别变量的影响达到显著性水平。

    R2代表着模型参量对因变量的解释能力,不同模型可以直接用R2来判断模型精确度的高低,其值越接近1,说明回归直线对于观测值的拟合效果越好。由表 4可知,该回归模型的调整后R=0.793,拟合度较好(预测变量同表 3)。Durbin-Watson统计量的值为2.010,与临界值(d=2)十分接近,在无自相关性的值域之中,认定残差独立,通过检验。说明变量之间基本没有自相关性,各个元素变量的独立性较好[20]

    图 2可知,标准化残差直方图呈一个倒扣的钟形,左右两侧基本对称。由图 3可知,标准化残差的预期累积概率-累积目标概率图中散点大部分靠近斜线,综合而言,残差符合正态分布。根据以上残差独立性检验和残差正态性检验的结果,认为数据基本满足线性回归要求,所建立的模型可按照拟合质量进行预测,即通过2.1节中聚类分析得到的样品类别与各元素之间可建立良好的拟合关系,说明聚类结果较为准确。

  • 判别分析是一种判断个体所属类别的统计分析手段[21-22],是根据已知对象的某些观测值和其所属类别来判断未知对象所属类别,因此可将判别分析与聚类分析相结合,建立判别模型对聚类分析结果进行检验。将2.1节中聚类分析的结果作为已知类别,对样品聚类结果进行逐步判别分析,根据判别函数计算得出相对应的得分, 样品最终划入得分最高的类中[23-24]。4个类别Wilk的Lambda检验判别结果见表 5

    function test Wilks Lambda chi square degree of freedom signification
    1~3 0.010 337.430 42 0.000
    2~3 0.129 149.223 26 0.000
    3 0.497 51.065 12 0.000

    Table 5.  Wilks Lambda result

    表 5可知,软件在判别过程中建立了3个判别函数,函数1、2、3的显著性水平均小于0.05,说明3个判别函数显著成立,采用这3个函数得到的判别结果较好,判别函数的特征值见表 6

    function characteristic value percent of variance/% cumulative/% regular correlation
    1 12.173* 76.0 76.0 0.961
    2 2.837* 17.7 93.7 0.860
    3 1.013* 6.3 100.0 0.709

    Table 6.  Eigenvalue of discriminant function

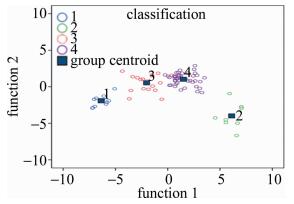
    表 6中的方差百分比反映了典型函数所能解释的方差变异程度(*表示分析中使用了前3种典型的判别函数),由函数1的方差百分比值为76.0%,函数2的方差百分比值为17.7%,函数3的方差百分比为6.3%,函数1所能解释的信息远远比函数2及函数3多。所以选取函数1作为区分样品的主要判别依据。函数1与函数2之间典型相关性系数分别为0.961和0.860,表示样品在函数1和函数2这两个维度上具有显著差异。故选择函数1和函数2作为函数判别轴建立联合分布图,结果见图 4

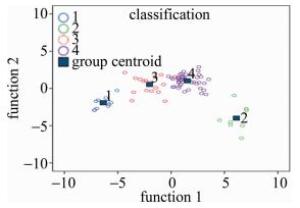
    Figure 4.  Joint distribution of discriminant functions

    图 4可知,1代表第Ⅰ类样品,2代表第Ⅱ类样品,3代表第Ⅲ类样品,4代表第Ⅳ类样品。这4类样品在函数1、函数2的判别轴上区分明显。由于函数1是区分样品的主要依据,在函数1的维度上,4类样本之间的差异性显著,同一类的样品均落在了同一区域。利用Fisher判别函数进行回判,样品回判正确率为100%,表明该判别模型对样品的区分效果显著。结果见表 7

    classifi-cation forecast group members total
    1 2 3 4
    initial count 1 12 0 0 0 12
    2 0 8 0 0 8
    3 0 0 19 0 19
    4 0 0 0 44 44
    percentage/% 1 100 0 0 0 100
    2 0 100 0 0 100
    3 0 0 100 0 100
    4 0 0 0 100 100

    Table 7.  Sample back judgment output table

    第Ⅰ类样品的线性判别函数是:

    第Ⅱ类样品线性判别函数是:

    第Ⅲ类样品线性判别函数是:

    第Ⅳ类样品线性判别函数是:

    (1) 式~(4)式中的Y1~Y4分别为判别函数的因变量,X1~X14分别为判别函数的自变量。

    表 7显示,100.0%的初始样品被正确分类,利用判别模型预测的样品类别与实际样品类别完全一致,若要检验其它未知样品的分类,只需将样品元素含量输入各变量中,就能直接在联合分布图上找到与之距离最近的分组质心,进而完成对未知样品的准确分类。

3.   结论
  • 本实验中利用X射线荧光光谱仪建立了一种鉴别香烟烟灰成分的方法,能够对香烟烟灰样品进行快速无损检测。首先根据X射线荧光光谱数据对样品进行定性半定量分析初步归类,而后利用SPSS软件,采用Ward法对样品进行更为科学的聚类, 实现了对香烟烟灰样品的种属划分。最后使用回归分析和判别分析对聚类结果进行评价,从而发现各元素与聚类分析产生的类别具有很强的拟合关系,再借助判别分析确定各类样品之间质心完全分离开来,判别情况良好,印证了系统聚类结果是准确可靠的。同时建立了判别函数模型,借助Fisher函数进行回判,得出的分类结果其归类正确率为100%。利用该方法对现场提取到的未知香烟烟灰物证,可通过该判别模型进行快速分类,从而提高烟灰物证的检验效率,为侦查提供帮助。

Reference (24)

Catalog

    /

    DownLoad:  Full-Size Img  PowerPoint
    Return
    Return