 Map
Map


HTML
-
平面液晶显示面板广泛应用于液晶电视、平板电脑、智能手机、车载显示屏等领域。由于其复杂的生产工艺,液晶面板生产过程中容易产生各种缺陷,其中面形变形会使面板在组装时边缘不贴合,体验感差、产生缝隙而导致进灰、进水等问题,严重影响器件的质量,因此面形的检测至关重要[1]。
面板3维信息测量方法可以分为接触式测量和非接触测量两大类[2]。接触式测量包括模板测量和表面轮廓仪、三坐标测量仪等仪器测量。模具测量需要对玻璃截面进行匹配测量,方法成本高、误差大[3]。三坐标测量仪测量精度高,但是设备体积大,无法进行便携式测量;由于测头一般采用硬度很高的材料,在测量时可能会对被测面造成划伤;而且是单点测量,测量速度慢。非接触式测量主要有激光三角法[4]、飞行时间法、阴影恢复形状法、光度立体法、光栅相位偏折法、立体视觉法。其中激光三角法主要是采用激光线扫描被测物表面获得面型坐标信息[5],但是由于液晶面板表面的高反射特性,反射的激光光线很难被相机接收。飞行时间法是通过测量光的传播时间来确定物体面型[6],但是很难达到较高精度,适用于较大测量范围和漫反射表面的测量。阴影恢复形状法是由HORN[7]最先提出,该方法只需要拍摄待测表面在某一特定光照条件下的一副灰度图,利用被测物表面单幅图像中波峰处与波谷处灰度的差异,重建被测物表面的3维形貌,但该方法对高反射表面物体的测量效果并不好。光栅相位偏折测量法具有较快的测量速度和较高的精度及稳定性,且该方法测量范围大。光栅相位偏折法分为条纹投影和条纹反射两种方式[8],其中条纹投影适用于漫反射表面物体的检测,条纹反射适用于高反射表面的3维形貌测量,条纹投影可分为基于单幅条纹和多幅条纹两种类型[9]。
由于玻璃平面镜具有高反射特性,本文中将条纹反射法应用于面形检测,通过分析经过被测镜面反射后的条纹镜像,计算镜面任一点的法线偏折,据此评价镜面面形误差。该方法具有非接触、测量速度快的优点。
-
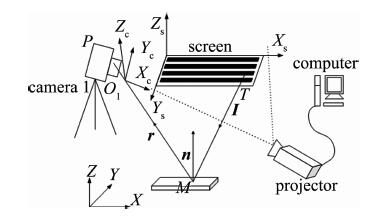
测量系统由工业相机、投影仪、漫反射光屏、被测镜面、计算机组成,如图 1所示。投影仪将由计算机生成的亮度呈正弦变化的条纹投影至漫反射光屏上,光屏上的条纹经过平面镜反射成像被相机获得。其中相机获得的条纹保持最大灰度值并且不过饱和,BABAIE等人[10]提出采用整体匹配关系产生光栅; WADDINGTON等人[11]采取减少投影强度来解决图像饱和问题。本文中采用自适应条纹投影[12],通过求解相机也投影仪响应曲线来求取最佳投影灰度值。

Figure 1. Schematic diagram of measurement system
T为光屏上任一点,设入射光线和反射光线的单位方向向量分别为i和r,P为T点经镜面反射后在相机的成像点,可以求得被测镜面反射点M的实际法线向量n:
(1) 式为点的实际法线向量,与该点法向量的理论值比较,得到镜面在该点的面形误差。理论法线向量可由被测镜面面形方程确定[13]。
-
P点坐标在相机坐标系下可直接求出。在相机针孔模型中,P, O1, M这3点共线,在已知相机外参和被测镜面形方程,当P坐标和相机光心O1的坐标确定后,M坐标由线PO1与被测镜面的面形方程联立得到。
T点坐标可由条纹相位得到,常见的条纹相位解法有最小二乘相位估计[14]、加窗傅里叶分析法[15-16]、四步相移法[17-18],本文中采用四步相移法计算条纹相位。在图 1中,光屏上的正弦条纹由电脑通过投影仪投射至光屏,投射的横、竖正弦条纹如图 2a、图 2b所示。
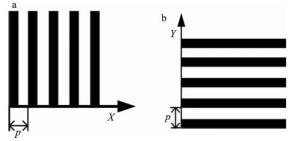
Figure 2. a—sine vertical stripes b—sine horizontal stripes
图 2a中光屏任意一点的光强分布为:
式中, A0为光强幅值,p条纹间距,x为横向坐标值。光屏上的条纹经过被测镜反射后,在相机的像素平面上任意一点P的光强表示为:
式中, I0是系统引入的背景噪声,像平面上的P点对应光屏上的T点的相位相等。首先求出P点的相位值Φ,再据相位相等,求出T点的坐标值。为了求出Φ,需要应用相移算法,加上相移算子δ后,(3)式可展开为:
采用四步相移算法,即令δ分别取值为0,π/2,π,3π/2,(4)式展开化简为:
可得到T点的相位值:
在光屏坐标系中T点的x坐标值为:
同理,将投射到光屏上的竖条纹改为横条纹如图 2b所示。重复上述计算过程可得到T点的纵向坐标值y,可以得到像素平面上任意P点相应的光屏上T点的位置坐标。由(6)式所获得的相位是由反正切函数值表示,根据反正切函数的固有性质,这些相位值仅处于[-π/2, π/2]区间内,把不连续的相位采用相位模2π扩展获得准确的Φ值,才能得到准确的x, y坐标值。
-
求出的P, M, T坐标分别位于相机坐标系、世界坐标系、光屏坐标系下,现将P, T的坐标统一到世界坐标系下。如图 1所示, 世界坐标系为XYZ,光屏坐标系为XsYsZs,相机坐标系为XcYcZc。
设光屏坐标系与世界坐标系的变化矩阵为N1, 相机坐标系与到世界坐标系的变化矩阵为N2。在被测镜面上贴上若干个不在一条直线上的标志点,获得这些标志点在相机坐标系和世界坐标系下的坐标,采用单片空间后方交会算法[19]可计算得到N2。N1的求解过程为分别求解旋转矩阵R、平移矩阵F。A,B,C为光屏坐标系XsYsZs坐标轴上的3点,其中A为原点,B为Xs轴上的一点,C为Ys轴上的一点,设在世界坐标系中它们的坐标分别为:A(x1, y1, z1),B(x2, y2, z2), C(x3, y3, z3)得到光屏坐标系的Xs, Ys轴在世界坐标系中的单位方向向量$ %\overrightarrow {\mathit{AB}} $, $ %\overrightarrow {\mathit{AC}} $。
设光屏坐标系变换到世界坐标系的旋转矩阵为:
则有:
(c1, c2, c3)为光屏坐标系的Zs轴在世界坐标系中的单位方向向量,由坐标轴的正交性和单位向量的性质有:
解(10)式求得c1, c2, c3, 这样就得到了光屏坐标系变换到世界坐标系的旋转矩阵R,平移矩阵F为:
-
对被测镜面的面形评价参量是法线偏差[20],即为被测点的测量法线与镜面面形方程在该点的理想法线的夹角偏差。测量点的实际法线表达如(1)式所示,理想法线由被测镜面方程给出。根据求解的N1, N2将P点和相机光心O1以及T点坐标统一变换到世界坐标系中,坐标分别表示为O1′(a′, b′, c′), P′(x4′, y4′, z4′), T′(x5′, y5′, z5′)。直线P′O1′的方程为:
联立直线P′O1′方程和被测镜面方程,即可求出在M点在世界坐标系中的坐标M′(x6′, y6′, z6′)、入射光线T′M′的单位方向向量i、反射光线M′P′的单位方向向量r。则点M′的法向单位向量在X, Y, Z方向的分量表示为:
如果某测量点的测量法线方向为(nX, nY, nZ),由被测镜面方程所求得的理想法线方向为(nX′, nY′, nZ′),则该点沿个方向的法线偏差分别为:
由(14)式就能求出M点在世界坐标系中沿X, Y, Z方向的法线偏差。同理,可求出被测平面任一点的法向偏差,从而可以对被测平面进行评价。
1.1. P, M, T点坐标求解

1.2. 各坐标系与世界坐标系关系求解
1.3. 法线偏差评价面形
-
为验证本文中所提出的面形检测方法的正确性,使用MATLAB仿真面形发生变化时用该方法检测的结果。仿真镜面面形方程中X和Y的取值在1pixel~20pixel范围内,以步长为1取值,z=20cosY, 如图 3所示。
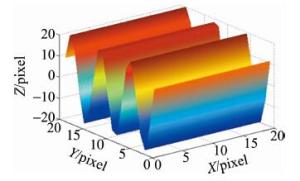
Figure 3. Simulation deformation mirror shape
图 4a是沿X方向的法线偏差分布图,图 4b是沿Y方向的法线偏差分布图,图 4c是沿Z方向的法线偏差分布图。

Figure 4. a—normal deviation distribution of X direction b—normal deviation distribution of Y direction c—normal deviation distribution of Z direction
表 1和表 2中分别给出了镜面中3个不同位置被测点的理论法线向量和实际法线向量,得出理论法线向量和实际法线向量的差值均值在1mrad以内。
theoretical normal vector results X direction/rad Y direction/rad Z direction/rad position 1 1.5708 0.3523 1.9231 position 2 1.5708 2.8432 1.8692 position 3 1.5708 2.9259 1.7865 Table 1. Theoretical normal vector results
actual normal vector results X direction/rad Y direction/rad Z direction/rad position 1 1.5711 0.3528 1.9235 position 2 1.5711 2.8441 1.8701 position 3 1.5713 2.9267 1.7874 Table 2. Actual normal vector results
-
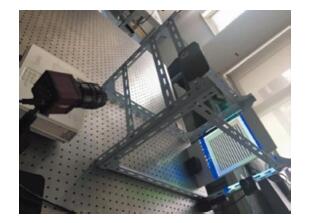
待测玻璃面板为三星某型号手机玻璃面板,屏幕尺寸为160mm×80mm,投影光屏尺寸为400mm×250mm。实验中相机型号为CatchBest UC320C,分辨率为2048pixel×1536pixel,相元尺寸为3.2μm×3.2μm, 综合考虑视场大小和光屏到被测物的距离,相机采用焦距为25mm的镜头。使用的相机均已经通过MATLAB相机标定工具箱严格标定出内参量,其中焦距为25.63mm,主点坐标为(3.15pixel, 3.09pixel), 2阶径向畸变系数为0.07,4阶径向畸变系数为-2.3,畸变模型为Brown畸变。可通过校准相机参量误差,提高条纹反射系统的测量精度[21]。摄影测量系统采用V-STAR动态摄影测量系统。搭建如图 5所示的实验系统图。

Figure 5. Experimental diagram of fringe reflection plane mirror measurement system
-
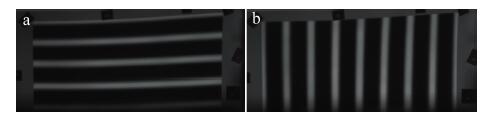
测量是在暗室环境下进行的,采集图像之前需要调节相机的曝光时间,使得到的图像不仅具有高对比度而且不会过饱和。图 6a和图 6b为测量相机拍摄的经被测镜反射后的横、竖条纹图像。
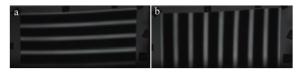
Figure 6. a—horizontal stripes taken by camera b—vertical stripes taken by camera
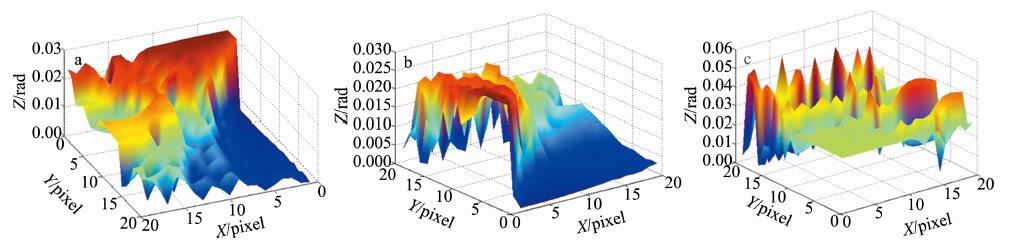
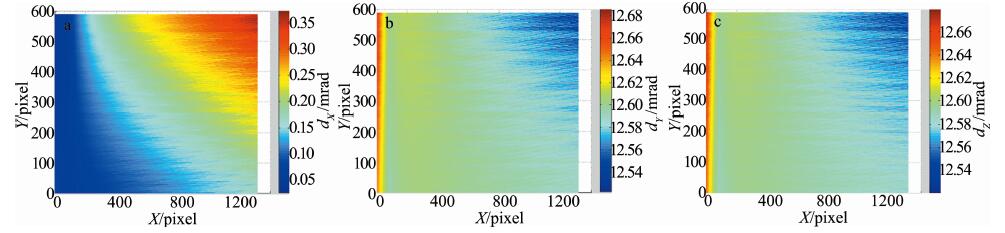
对手机玻璃面板在一天内重复测量7次,测量间隔为10min。图 7为其中一次的测量结果。其中图 7a表示的是沿方向的法线偏差分布图,图 7b表示的是沿Y方向的法线偏差分布图,图 7c表示的是沿Z方向的法线偏差分布图。
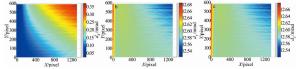
Figure 7. a—normal deviation distribution in X direction b—normal deviation distribution in Y direction c—normal deviation distribution in Z direction
表 3中给出了被测面上某一个点沿X方向、Y方向、Z方向法线偏差的7次测量结果。表 4中给出被测镜面在X方向、Y方向、Z方向法线偏差的7次测量结果的标准差。
number of measurements normal deviation of X direction/mrad normal deviation of Y direction/mrad normal deviation of Z direction/mrad 1 0.0886 0.0127 0.0126 2 0.0877 0.0126 0.0126 3 0.0869 0.0123 0.0126 4 0.0844 0.0126 0.0126 5 0.0861 0.0126 0.0125 6 0.0853 0.0127 0.0126 7 0.0847 0.0125 0.0128 standard deviation 0.0016 0.0001 0.0001 Table 3. Seven measurements at the same point
由表 3可知, 被测镜面同一点7次重复测量沿X方向、Y方向、Z方向的法线偏差的标准差为0.0016mrad, 0.0001mrad, 0.0001mrad。表 4表明, 7次测量,沿着X方向、Y方向、Z方向的总体法线偏差均在1mrad内,证明测量方案可靠性高。
results of seven measurements standard deviation of normal deviation of X/mrad standard deviation of normal deviation of Y/mrad standard deviation of normal deviation of Z/mard maximum 0.9899 0.9507 0.8978 minimum 0.8121 0.9182 0.8642 average 0.9112 0.9365 0.8835 Table 4. Standard deviation of the spell deviation
2.1. 仿真验证结果

2.2. 实验装置搭建
2.3. 实验测量结果
-
研究了基于光栅相位偏折法的条纹反射原理,通过法线偏差完成对高反射平面镜的面形评价,并设计实验方案验证了测量方法的可行性。计算机仿真和实验结果表面,该测量方法具有良好的可靠性,随机误差较小,重复性精度优于1mrad,可完成被测镜面整体面形的检测。同时该测量方法对实验设备的位置无特殊要求,不需要复杂标定。
 DownLoad: