Advanced Search

ISSN1001-3806 CN51-1125/TN Map

Volume 44 Issue 5
Sep.  2020
Article Contents
Turn off MathJax

Citation:

Research on strain field detection system for complex surface based on FBG

  • Received Date: 2019-10-09
    Accepted Date: 2019-11-29
  • In order to collect the real-time strain distribution of complex surface shapes, and provide data support for the health assessment of complex surface structures, the strain field detection system for complex surface was designed with fiber-optic sensor network. The system consisted of a fiber laser, a coupler, a demodulator, and a fiber sensing array. The method was compared with the optical scanning detection data, and the theoretical analysis and simulation calculation of the strain distribution were carried out under many different conditions. The strain distribution of the device under test with a variety of different force conditions was simulated and analyzed. The results show that the strain distribution is related to the applied position, size and surface structure. A 5.0mm aluminum plate was tested and compared with simulation data in the experiment. Four groups of fiber grating sensors were placed on the surface to be measured in an orthogonal structure arrangement. The test results show that the maximum wavelength offsets are 1.324nm, 2.547nm, and 1.643nm, and the corresponding shift offsets are 0.244mm, 0.523mm, and 0.347mm, respectively. Compared with the calibration data of laser scanning method, the offset of this method is relatively less than 10%. The test data can reflect the trend of surface shape change, and it meets the design requirements.
  • 加载中
  • [1]

    ZHANG R Sh, WU Sh, TU Q Ch. Design and application of high spatial resolution distributed temperature sensing system[J]. Optical Instruments, 2015, 1(1): 83-86(in Chinese).
    [2]

    CLEMENTS G M. Fiber optic sensor for precision 3-D position mea-surement: US 6888623[P].2005-05-03.
    [3]

    AL-ANANY Y M, TAIT M J. Fiber-reinforced elastomeric isolators for the seismic isolation of bridges[J]. Composite Structures, 2016, 160(1):300-311.
    [4]

    LIU Zh Ch, YANG J H, WANG G. Research on spectrum correction algorithm of temperature measurement system based on FBG[J]. Spectroscopy and Spectral Analysis, 2014, 34(7): 1793-1796(in Chinese).
    [5]

    KHAN M M, PANWAR N, DHAWAN R. Modified cantilever beam shaped FBG based accelerometer with self temperature compensation[J]. Sensors and Actuators, 2014, A205:79-85.
    [6]

    ALMAZYAD A S, SEDDIQ Y M, ALOTAIBI A M, et al. A proposed scalable design and simulation of wireless sensor network-based long-distance water pipeline leakage monitoring system[J]. Sensors, 2014, 14(2):3557-3577. doi: 10.3390/s140203557
    [7]

    REN X F, JIA D. ZHAO H, et al. Research of structure health monitoring technology for ancient architecture based on FBG[J]. Chin-ese Journal of Sensors and Actuators, 2015, 28(1): 34-38(in Chin-ese).
    [8]

    SUMAYYAH M I, MOHAMMED R H A, AIMAN I. Sensitivity and stability characterization of linear cavity erbium-doped fiber laser for pressure measurement[J]. Microwave & Optical Technology Letters, 2012, 54(11):2447-2449.
    [9]

    LEANDRO D, DEMIGUEL-SOTO V, LOPEZ-AMO M. High-resolution sensor system using a random distributed feedback fiber laser[J]. Journal of Lightwave Technology, 2016, 34(19):4596-4602. doi: 10.1109/JLT.2016.2536650
    [10]

    LIU M Y, HU Y F, ZHANG Zh J, et al. FBG pressure sensor based on polymer packaging[J]. Chinese Journal of Scientific Instrument, 2016, 37(10): 2392-2398(in Chinese).
    [11]

    LIU Zh Ch, YANG J H, ZHANG L, et al. Granary temperature measurement network based on chirped FBG[J]. Spectroscopy and Spectral Analysis, 2016, 36(10):3377-3380(in Chinese).
    [12]

    JIAN X, DEXING Y, CHUAN Q, et al. Study and test of a new bundle-structure riser stress monitoring sensor based on FBG[J]. Sensors, 2015, 15(11):29648-29660. doi: 10.3390/s151129648
    [13]

    BABIN S A, VATNIK I D. Random-distributed feedback fiber lasers based on Rayleigh scattering[J]. Optoelectronics Instrumentation and Data Processing, 2013, 49(4): 323-344. doi: 10.3103/S8756699013040018
    [14]

    SONG Y M, MENG F Y, LOU X P, et al. Research on static load identification using FBG orthogonal sensing network[J]. Journal of Electronic Measurement and Instrumentation, 2017, 31(8) : 1227-1232(in Chinese).
    [15]

    RONG D D, ZHANG Y M, SONG Y M, et al. Study on the sensing characteristics of cylindrical metallic-packaged FBG sensor[J]. Ch-inese Journal of Scientific Instrument, 2019, 40(1): 117-124(in Chinese).
    [16]

    QU D M, SUN G K, LI H, et al. Optical fiber sensing and reconstruction method for morphing wing flexible skin shape[J]. Chinese Journal of Scientific Instrument, 2018, 39(1): 144-151(in Chinese).
    [17]

    TAN X M, BIAN G X, CHEN Y L, et al. Study on realtime corrosion monitoring of aircraft different metal joint structure based on fiber Bragg grating[J]. Structure & Environment Engineering, 2017, 44(2): 53-58(in Chinese).
    [18]

    WANG P, ZHANG M M. Research on thermal strain comparison test of carbon fiber composite materials[J]. Foreign Electronic Measurement Technology, 2018, 37(8): 6-10(in Chinese).
    [19]

    TIAN Sh Zh, QIU W Ch, WEN K, et al. Application research on FBG sensor in the monitoring of fracture and damage[J]. Laser Technology, 2017, 41(1): 129-132(in Chinese).
  • 加载中
通讯作者: 陈斌, bchen63@163.com
  • 1. 

    沈阳化工大学材料科学与工程学院 沈阳 110142

  1. 本站搜索
  2. 百度学术搜索
  3. 万方数据库搜索
  4. CNKI搜索

Figures(5) / Tables(1)

Article views(4938) PDF downloads(12) Cited by()

Proportional views

Research on strain field detection system for complex surface based on FBG

  • 1. School of Electrical and Information Technology, Jilin Vocational College of Industry and Technology, Jilin 132013, China
  • 2. 2 School of Opto-Electronic Engineering, Changchun University of Science and Technology, Changchun 130013, China

Abstract: In order to collect the real-time strain distribution of complex surface shapes, and provide data support for the health assessment of complex surface structures, the strain field detection system for complex surface was designed with fiber-optic sensor network. The system consisted of a fiber laser, a coupler, a demodulator, and a fiber sensing array. The method was compared with the optical scanning detection data, and the theoretical analysis and simulation calculation of the strain distribution were carried out under many different conditions. The strain distribution of the device under test with a variety of different force conditions was simulated and analyzed. The results show that the strain distribution is related to the applied position, size and surface structure. A 5.0mm aluminum plate was tested and compared with simulation data in the experiment. Four groups of fiber grating sensors were placed on the surface to be measured in an orthogonal structure arrangement. The test results show that the maximum wavelength offsets are 1.324nm, 2.547nm, and 1.643nm, and the corresponding shift offsets are 0.244mm, 0.523mm, and 0.347mm, respectively. Compared with the calibration data of laser scanning method, the offset of this method is relatively less than 10%. The test data can reflect the trend of surface shape change, and it meets the design requirements.

引言
  • 光纤布喇格光栅(fiber Bragg grating,FBG)传感器[1-3]是一种比较理想的无源传感与信号解调器件,应用于弯曲、位移、压力、应变、温度等多个参量的测量。光纤传感技术在航天、航海、石油化工、电力、生物医学等应用广泛[4-6]。针对复杂面形等进行检测时,由于受到自身重量、外界应力等因素产生应变而导致变形及偏移时,若不进行偏移量补偿,则导致基准测量不准,进而影响装配质量等问题。

    目前,用于复杂面形的应变传感测量方法主要包括直接测量法[7]、电子测量方法[8]、光学测量法[9]和视觉测量法等[10]。直接测量法通过测量测量物体长度变化量从而测得应变大小,当物体或结构庞大或不易找到两个测量端时,该方法不可行[11]。电子测量方法是采用电阻应变片实现某一点的应变测量,这种测量方法虽然技术成熟、尺寸小、精度和灵敏度高,但不能进行3-D应变测量,容易受到电磁干扰,抗腐蚀能力弱[12]。激光扫描技术可实现非接触测量,测量范围和测量精度均可调,但该方法受CCD视场范围限制较大[13]。根据以上分析,FBG传感器[14-18]的优点在于抗电磁干扰、灵敏度高、尺寸小、重量轻、成本低, 适于在高温、腐蚀性等复杂环境中使用,在结构工程测量应变方面更有优势。本文中基于FBG传感网络的复杂面形应变场检测系统进行深入研究,实现复杂面形的基准位置、变形程度、变化趋势的定量测量,从而将应变场补偿量转化为位置精度修正量,得到校正模型以实现高精度数字化装配的应用。

1.   系统设计
  • 系统总体设计如图 1所示。系统采用宽带光源为系统提供初始信号光,光通过光纤进入光纤耦合器,再进入FBG阵列段,分布在工件上的FBG阵列将各个测试点位上的应变物理量转化为FBG波长偏移量。FBG阵列分布满足在不同梯度上均匀排布的要求,图 1中3条曲率变化不同的虚线表征梯度,将FBG阵列在3条特征梯度线上进行分布排列。这些回波再次通过光纤耦合器从而进入解调仪,由解调仪完成对回波光谱的解算,最终将各点位的数据转换成应变场分布数据。这些应变场分布数据可以根据不同的位置再验算成对应标准工件中3维坐标,在与标准数模中的坐标进行比较差分运算,从而获得数字装配校正数据。

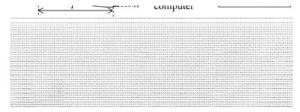
    Figure 1.  Complex surface shape strain field detection system

    在工件受自身重力或外力产生形变的时候,工件表面会产生变形,从而导致FBG栅格受到影响,回波波长产生偏移,并且可以通过波长偏移量计算表面形变特性。设工件厚度为h,测试位置尺寸为l,变形量为Δl,当测试环境的温度恒定时,FBG探测点上的波长偏移与该点位上的应变符合(可由参考文献[19]中(2)式在温度补偿后化简得到):

    式中,λB为FBG的回波波长;ΔλB为FBG的回波波长偏移量;Pe为等效弹光系数。当黏贴在工件表面的FBG阵列跟随工件面形变化时,通过检测分析各个FBG位置的波长偏移量ΔλB,就能够完成各个位置应变量ε(即Δl/l)的计算。通过应变量变化完成对标准点3维坐标偏移量的计算,实现对工件标准点的校正。

    设复杂面形待测件的数模标准点集合为U(x, y, z),则当工件装配状态改变时,实际工件标准点集合为U′(x, y, z)。在工件装配过程中, 为了保证状态改变产生的形变不造成装配超差现象,需要获得实际标准点集合与数模标准点集合的偏差集合ΔU(x, y, z),该集合通过应变场测试数据反演得到,有:

    式中,f(ε)表示应变-坐标位置转换函数。最终,可以解算获得实际标准点的坐标为:

2.   仿真分析
  • 采用SolidWorks软件对复杂曲面工件进行应变场及工件变形后微位移场模拟分析,仿真时板材材料选用601铝合金,厚度为5mm,密度为68.9kg/m3,泊松比为0.33。采用两段夹持、曲面区域不同位置施力的方法模拟,模拟施力范围50N~200N。将各点位上的FBG应变测试值解算后,再通过连续化插值的方法将有限点数据构建成结构曲面应变场分布,再结合工件材料特性,仿真结果如图 2所示。

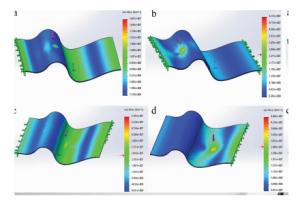
    Figure 2.  Simulation results of strain and displacement

    对模拟工件进行应变场仿真,施力点分别在曲面顶点和底面,工件参量设置与实验拟测试工件一致,材质为合金铝,长20mm、宽10mm、厚5mm,(l×d×h),表面呈不规律弯曲面形结构,外部施力F=200N。由图 2a可知,当施力点在工件顶点时,顶面因受到外应力作用而产生变形,但变形程度不大,而其对应的下曲面段承受了主要作用力,其最大微位移变形量为0.301mm;由图 2b可知,当施力点在工件顶点左侧时,应变范围明显大于顶点位置,但整体变形程度不大,其最大微位移变形量为0.426mm;由图 2c可知,当施力点在工件顶点右侧时,左侧及顶面部分基本不变形,而右侧及底部曲面都发生了较明显的变形,其最大微位移变形量为0.512mm;由图 2d可知,当施力点在工件底面时,底面因受到外应力作用而产生形变,形变分布以应变施力点为中心向外扩散,其最大微位移变形量为0.127mm,主要微位移区间在施力点附近。由此可见,不同应力施力点造成的微位移分布并不完全由施力点所决定,还会受工件结构所影响,故在FBG阵列分布设计时需要根据工件外形进行相应的分布调整。但整体趋势是应变场会根据施力点向支撑端延伸,垂直于支撑段的应变场衰减快,总体衰减趋势单调,但不同方向上衰减速率具有明显差异。

    根据仿真分析结果可知,为了全面准确地反映待测工件的应变场分布,需要将FBG阵列尽可能地在不同梯度上均有一定排布,从而完整地获得整个工件面形应变场分布,更好地服务于数字化装配。以此设计思路,按照工件面形曲率变化程度设置了3条特征梯度线,并将FBG阵列在3条特征梯度线上进行分布排列。该排布设计可以最大程度反映不同梯度条件下的应变场分布,从而反映工件面形变化的真实状态。

3.   实验
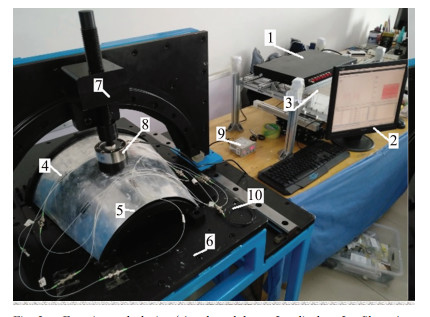
  • 系统采用THORLABS公司的ASE宽带光源,1分2光纤耦合器,SOIL公司的BSIL-GS602型光纤光栅解调仪,表面黏贴型FBG传感探头。将FBG探头按照待测工件曲率分布梯度线均匀分布在待测表面上。工件的材质为合金铝,实验系统如图 3所示。

    Figure 3.  Experimental device(1—demodulator, 2—display, 3—fiber, 4—FBG, 5—complex surface, 6—test tooling, 7—force arm, 8—pre-ssure sensor, 9—display for pressure, 10—FBG for temperature compensated)

  • 将FBG阵列按照所设计的结构形式进行排布,每条梯度线上分布3个探头,以顶点右侧面载力的测试数据为例,9个探头的应变测试数据如表 1所示。数据分析表中分别给出仿真分析值、应变测试验算值以及光学扫描测试值。

    FBG
    No.
    wavelength
    shift/
    nm
    simulation
    result/
    mm
    micro-
    displacement/
    mm
    optical scan
    test value/
    mm
    relative
    error/
    %
    1 0.048 0.005 0.006 0.0055 9.1
    2 1.324 0.214 0.244 0.2237 8.7
    3 0.154 0.021 0.024 0.0221 8.6
    4 0.624 0.137 0.141 0.1359 3.8
    5 2.547 0.512 0.533 0.5047 5.6
    6 0.445 0.120 0.132 0.1415 6.7
    7 0.414 0.125 0.118 0.1288 8.4
    8 1.643 0.351 0.347 0.3621 4.2
    9 0.158 0.042 0.046 0.0429 7.2

    Table 1.  Strain data of FBG

    表 1所示,工件不同位置上对外加施力点的波长响应是不同的,其反映的微应变量也存在很大差异,故其微位移量也是根据不同位置而具有不同特性的。FBG序号从耦合器进入端开始顺序标识(No.1~No.9)。在以顶点右侧面载力条件下,斜线向下的曲率分布的3根FBG探头而言,5号波长偏移量最大,达到2.547nm,形成0.523mm的微位移,3号与7号亦有变化,但由此可见微位移改变量并不完全取决于距施力点的距离,与工件面形曲面位置也有关,该曲率梯度线上微位移量平均误差为0.012mm。底面曲率分布的3根FBG探头而言,6号波长偏移量最大,达到0.445nm,形成0.132mm的微位移,3号与9号变化基本一致,可见在平面条件下,应变场主要受到施力点与测试点距离的影响,该曲率梯度线上微位移量平均误差为0.009mm。直线向上的曲率分布的3根FBG探头而言,8号波长偏移量最大,达到1.643nm,形成0.347mm的微位移,7号与4号、1号应变量与位移量相近,可见曲面位置上对微位移量的影响主要由曲率决定。实验中测得最大波长偏移量为1.324nm, 2.547nm和1.643nm,其分别对应的位移偏移量为0.244mm,0.523mm和0.347mm。将应变验算数据与光学精密测量数据对比可知,其相对误差均小于10%,应变数据可以有效反应结构形变。由实验数据可知,系统微位移量与应变FBG获取的波长偏移量具有函数关系,即可通过解调计算波长偏移量值实现对复杂面形应变场的检测。

  • 根据FBG阵列获取的应变场分布测试数据可知,不同位置的外部施力会使工件产生变形,形变的量级受作用力大小、施力位置、曲面形态等所决定。根据波长偏移量与微位移量测试数据绘制的函数曲线如图 4所示。

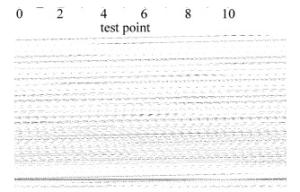
    Figure 4.  Displacement function of wavelength shift

    在此基础上,对FBG阵列的位移偏移量测试数据与仿真数据进行误差分析,结果如图 5所示。

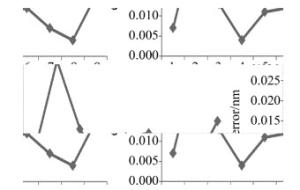
    Figure 5.  Test error of different FBG

    图 5可知,第1组FBG阵列(No.1~No.3)中位移偏移量平均误差是0.016nm,第2组FBG阵列(No.4~No.6)中位移偏移量平均误差是0.009nm,第3组FBG阵列(No.7~No.9)中位移偏移量平均误差是0.009nm。分析认为,包含拱面的测试数据误差相对较大,而平面部分的测试数据误差较小,系统总体平均误差符合要求。

4.   结论
  • 本文中通过FBG传感阵列完成了对复杂面形工件的应变场及位移偏移量的测试。仿真计算了不同施力条件下待测件的应变分布和位移偏移量。实验验证了影响位移偏移量的主要参量,并给出了误差分布曲线。本系统对复杂面形工件的应变场及位移偏移量具有稳定的测试效果。

Reference (19)

Catalog

    /

    DownLoad:  Full-Size Img  PowerPoint
    Return
    Return