Advanced Search

ISSN1001-3806 CN51-1125/TN Map

Volume 44 Issue 4
Jul.  2020
Article Contents
Turn off MathJax

Citation:

Numerical and experimental study on temperature field of activated laser welding 304 stainless steel

  • Received Date: 2019-07-23
    Accepted Date: 2019-09-08
  • In order to study the effect of the active agent on the temperature of the molten pool of laser welding samples, the ANSYS 3-D finite element model of active laser welding was established with 304 stainless steel thick plate as the object. In the model, the welding temperature field was numerically simulated, and the infrared thermal imager was used to monitor the melting. Based on the comprehensive numerical calculation and experimental test data, the temperature variation trend of the specimens coated with different active agents and uncoated active agents during laser welding was compared and analyzed. The results show that the numerical simulation results are basically consistent with the experimental results. The application of the active agent does not have a significant effect on the temperature field distribution, but the peak temperature of the molten pool is slightly changed. Compared with the uncoated active agent welded specimens, SiO2 and TiO2 active agent respectively raises the peak temperature of the molten pool by about 7% to 9%, and the NaF active agent reduces the peak temperature of the molten pool by about 5%. This research will enrich and develop the basic theory of active laser welding thick plates, and provide important theoretical and experimental basis for the popularization and application of active laser welding.
  • 加载中
  • [1]

    KUO M, SUN Z, PAN D. Laser welding with activating flux[J]. Science and Technology of Welding and Joining, 2001, 6(1):17-22. doi: 10.1179/136217101101538497
    [2]

    MEI L F, WANG Zh H, YAN D B, et al. Experimental study on active laser penetration welding of body galvanized steel[J]. Hot Working Technology, 2016, 45(17):31-34(in Chinese).
    [3]

    CHEN L, HU L Y, GONG Sh L, et al. Research on surfactant welding technology[J]. New Technology & New Process, 2005, 17(4): 39-41(in Chinese).
    [4]

    ZHANG R H, YIN Y, FAN D, et al. Numerical simulation of depth increasing mechanism of A-TIG welding[J]. Chinese Journal of Mechanical Engineering, 2008, 44(5): 175-178(in Chinese). doi: 10.3901/JME.2008.05.175
    [5]

    ZHAO Y Zh, LEI Y P, SHI Y W. Effect of surfactant sulfur on flow pattern and depth ratio of weld pool[J]. Chinese Journal of Mechanical Engineering, 2004, 40(9): 138-143(in Chinese). doi: 10.3901/JME.2004.09.138
    [6]

    DENG J Q. Simulation and experimental study on the dynamic behavior of laser deep welding keyhole and weld pool[D].Changsha: Hunan University, 2016: 14-18(in Chinese).
    [7]

    BALASUBRAMANIAN K R, BUVANASHEKARAN G, SANKARANARAYANASAMY K. Modeling of laser beam welding of stainless steel sheet butt joint using neural networks[J].CIRP Journal of Manufacturing Science and Technology, 2010, 3(1):80-84. doi: 10.1016/j.cirpj.2010.07.001
    [8]

    WU X. High temperature mechanical and physical properties of stainless steel[D]. Lanzhou: Lanzhou University of Technology, 2010: 48-53(in Chinese).
    [9]

    HU L X, ZHOU D W, JIIA X, et al. Laser butt welding and numerical simulation of Zr-Sn-Nb-Fe zirconium alloy sheet[J]. Chinese Journal of Lasers, 2016, 43(7): 0702002(in Chinese). doi: 10.3788/CJL201643.0702002
    [10]

    QUAN W W, LIU Sh H, LIU J L, et al. Experimental study on low power pulsed active laser welding of stainless steel[J]. Laser Technology, 2011, 35(3): 395-397(in Chinese).
    [11]

    PAN X D, LIU J H, BAO H T, et al. Effect of active agent on YAG laser-arc welding of stainless stell[J]. Aeronautical Manufacturing Technology, 2010, 53(11):92-95.
    [12]

    SU Y D. Research on thermal efficiency of laser deep fusion welding[D].Beijing: Beijing University of Aeronautics and Astronautics, 2000: 54-58(in Chinese).
    [13]

    MA L C, LIU J H, XIE Y Zh, et al. Preliminary study on the effect of laser welding activity on plasma[J]. Electric Welding Machine, 2005, 35(7):35-38(in Chinese).
    [14]

    LIU W Q, LI Y Q, LIU F D, et al. Effect of surfactant on weld defect of laser-arc composite welding[J]. Applied Laser, 2016, 36(3): 311-315(in Chinese).
    [15]

    LUO Y, XIE X J, HAN J T, et al. Effect of TiO2 active agent on acoustic emission of laser welding plasma in stainless steel[J]. Transactions of the China Welding Institution, 2016, 37(10): 109-112(in Chinese).
  • 加载中
通讯作者: 陈斌, bchen63@163.com
  • 1. 

    沈阳化工大学材料科学与工程学院 沈阳 110142

  1. 本站搜索
  2. 百度学术搜索
  3. 万方数据库搜索
  4. CNKI搜索

Figures(8) / Tables(3)

Article views(8860) PDF downloads(20) Cited by()

Proportional views

Numerical and experimental study on temperature field of activated laser welding 304 stainless steel

  • 1. Department of Mechanical and Automotive Engineering, Xiamen University of Technology, Xiamen 361024, China
  • 2. Fujian Provincial Key Laboratory of Bas Advanced Design and Manufacture, Xiamen 361024, China

Abstract: In order to study the effect of the active agent on the temperature of the molten pool of laser welding samples, the ANSYS 3-D finite element model of active laser welding was established with 304 stainless steel thick plate as the object. In the model, the welding temperature field was numerically simulated, and the infrared thermal imager was used to monitor the melting. Based on the comprehensive numerical calculation and experimental test data, the temperature variation trend of the specimens coated with different active agents and uncoated active agents during laser welding was compared and analyzed. The results show that the numerical simulation results are basically consistent with the experimental results. The application of the active agent does not have a significant effect on the temperature field distribution, but the peak temperature of the molten pool is slightly changed. Compared with the uncoated active agent welded specimens, SiO2 and TiO2 active agent respectively raises the peak temperature of the molten pool by about 7% to 9%, and the NaF active agent reduces the peak temperature of the molten pool by about 5%. This research will enrich and develop the basic theory of active laser welding thick plates, and provide important theoretical and experimental basis for the popularization and application of active laser welding.

引 言
  • 活性激光焊接是在试样表面涂敷一层具有特殊化学成分的活性剂,通过一定的焊接规范达到改善焊接缺陷、提高焊接效率[1-2]。近几年, 把激光与活性焊接技术结合从而将活性焊接技术的优点引入激光焊接, 成为世界范围内迅速发展的一种新型焊接前沿技术[3]

    目前,活性激光焊接在国内外均已初步取得一些进展, 主要是特定条件下开展的一些初步理论探索和工艺试验研究。由现有的研究发现, 活性剂会对激光能量的吸收、等离子体的密度、熔池的流动状态等产生一定的影响[4-5]。而在焊接过程中激光能量、等离子体及熔池的变化均会影响到熔池温度场[6]。目前,针对活性激光焊接熔池温度变化特性的研究主要是关于活性激光焊接薄板的数值模拟,对于焊接难度更大、焊后缺陷更多的中厚板研究较少。

    作者在数值模拟得到活性激光焊接温度场的基础上,对比焊接实时监测试验测得的熔池温度,系统分析了活性剂的涂敷对熔池温度的影响规律,进而验证数值计算熔池温度场的可靠性与准确性,分析活性剂对熔池温度的影响,为活性激光焊接的发展奠定理论与试验基础。

1.   试验条件
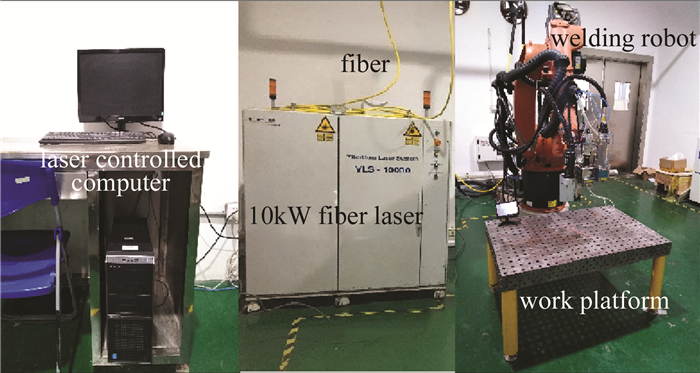
  • 试验中选用IPG公司的光纤激光器,型号为IPG-YLS-10000,焊接头安装在六自由度机器人上,并用氩气保护焊接熔池。同时采用FLIR A615红外热像仪检测焊接过程中焊缝的温度变化信号。热像仪的分辨率为640pixel×480pixel,最小聚焦距离为0.25m,焦距比数为1.0,相频为50Hz。试验设备平台如图 1所示。

    Figure 1.  Test platform

    试验板材为304不锈钢,试样尺寸规格为100mm×40mm×5mm, 其化学成分和力学性能如表 1所示。活性剂选定SiO2、TiO2和NaF 3种AR(analytical reagent)级分析纯粉末。

    type of steel mass fraction tensile strength/(N·mm-2)
    304 stainless steel C Si Cr Mn Ni P S ≥520
    ≤0.0008 ≤0.0100 0.1800~0.2000 ≤0.0200 0.0800~0.1100 ≤0.00035 ≤0.00030

    Table 1.  Chemical composition and mechanical properties of 304 stainless steel

2.   试验研究方法
  • 采用红外热像仪对不同活性剂作用下激光焊接试样的熔池温度进行监测,对相应焊接过程建立有限元模型,并数值模拟其焊接温度场。对比分析数值计算与试验监测结果,揭示试样表面活性剂对激光焊接熔池温度场的影响。

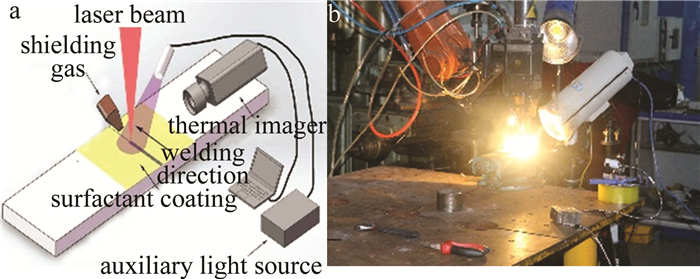
  • 试验采用两块304不锈钢板材对接在一起,将试样对接端面用精细锉刀修整至平整光滑,用夹具夹紧。活性剂涂敷至刚好遮住不锈钢表面金属光泽。待板材表面活性剂涂层的无水乙醇挥发后进行焊接试验。同时,采用红外热像仪对焊接过程中熔池温度的变化趋势进行监测。试验方案示意图及试验过程如图 2所示。通过正交试验得到一组较优的焊接工艺参量,具体数据如表 2所示。

    Figure 2.  Welding diagram and test procedure

    parameter laser power P/W defocusing amount Δ/mm welding rate v/(mm·s -1) protective gas flow q/(L·min -1) shielding angle/(°)
    value 2500 -2 15 15 45

    Table 2.  Welding parameters

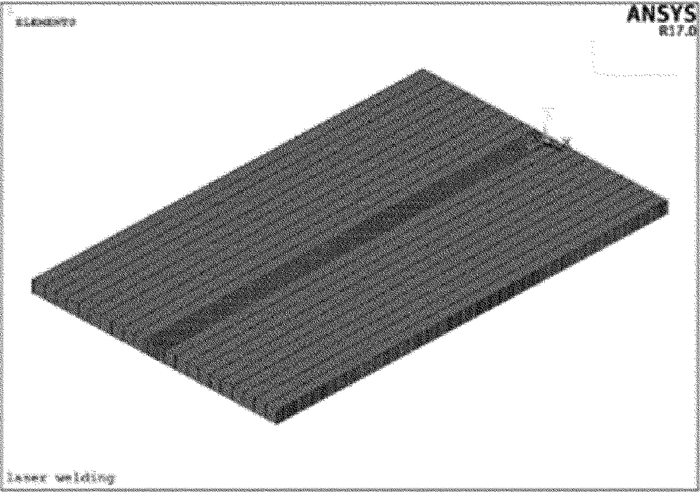
  • 建立焊接过程热传导模型。由于焊接过程中热源高度集中且快速移动,焊缝区域温度梯度变化大,而远离焊缝区域温度梯度逐渐减小。因此,划分网格时采用非均匀网格,对焊缝区域的网格进行局部加密[7],网格划分模型如图 3所示。通过等效法建立活性剂模型,即将活性剂涂层贴合到已建立好的试件模型焊缝处,活性剂厚度为0.1mm,活性剂物理性能参量见表 3。温度场模拟中考虑不锈钢材料的密度、比热容和导热系数等热物理性能参量随温度变化的情况,具体数据引用参考文献中的不锈钢高温力学性能及高温物理性能指标。

    Figure 3.  Meshing

    type of active agent density/(mg·mm-3) thermal conductivity/(W·m-1·K-1) specific heat capacity/(mJ·mg-1·K-1)
    SiO2 2.27 1.4 0.966
    TiO2 4.20 45 0.132
    NaF 1.125 129.9 299.8

    Table 3.  Thermophysical parameters of the active agent

  • 初始条件设为0℃,选择高斯热源模型,通过转化坐标的方式加载在试件模型表面[9]。实际焊接中,影响因素众多,为了简化模型,不考虑焊接过程中材料的相变潜热、汽化与电离,边界条件只考虑与空气的辐射和对流换热。

3.   结果与分析
  • 由数值模拟得到的激光焊接结束时各试样上的温度场分布云图如图 4所示。由图可见,焊接温度场模拟结果近似为以焊接方向为长轴的椭圆,越靠近激光中心的位置,因受到激光的直接作用,温度较高,其中,未涂敷活性剂试样中心最高温度达到2179.38℃,涂敷SiO2活性剂试样中心最高温度达到2199.34℃,涂敷TiO2活性剂试样中心最高温度达到2180℃,涂敷NaF活性剂试样中心最高温度达到2069.17℃。偏离激光中心位置的区域仅靠热传导获得热量,受激光热源或活性剂作用的影响较小,因此温度均较低,且在焊接结束时这些试样上的最低温度值相差很小。由此可见,活性剂的涂敷未显著改变激光焊接过程中试样上的温度场分布,但对试样熔池区域的最大温度值略有影响。图 5为试样熔池中某一固定点在焊接过程中的温度变化曲线。由图可见,试件在热源经过时迅速升温到达峰值温度,热源离开后,温度逐渐下降。其中,涂敷SiO2活性剂试样最先达到峰值温度,峰值温度为2837.65℃;其次未涂敷活性剂试样达到峰值温度,峰值温度为2631.92℃;最后涂敷TiO2活性剂试样与涂敷NaF活性剂试样达到峰值温度,他们的峰值温度分别为2831.73℃和2499.99℃。由结果可知,活性剂对熔池温度变化趋势的影响不大,但对试样的温升速率和峰值温度有一定的影响。其中,涂敷SiO2活性剂试样的温升速率最快。此外,与未涂敷活性剂试样的峰值温度对比,涂敷SiO2活性剂和TiO2活性剂会使峰值温度升高约8%,涂敷NaF活性剂会使峰值温度降低约5%。

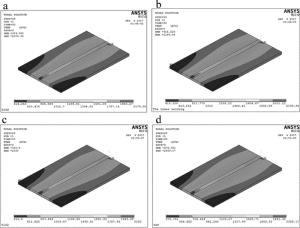
    Figure 4.  Distribution cloud chart of temperature

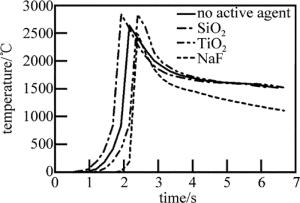
    Figure 5.  Temperature curve of fixed point in molten pool

    活性剂改变熔池温度的机理并非一种。产生差异的原因主要包括3点,一方面活性剂在分子能量方面增大了激光的吸收率,这是因为组成活性剂的元素中,O(氧)、F(氟)在自然界中电负性最大,Si, Ti则电负性较小,组成分子元素的电负性差异越大则分子极性越大,从而对激光的吸收率较高;另一方面,活性剂颗粒涂层减小了工件表面对激光的反射和散射[10];此外,活性原子在激光焊接过程中因吸附光致等离体中的自由电子而转变成带负电的负粒子,进而有效降低了焊接等离子体的电子密度,这在一定程度上削弱了等离子体对激光束的反射、折射、逆韧致吸收及散射等负效应,从而有效增加了到达焊接试样表面的激光功率密度[11-12]。活性剂的这几种作用机制,均可有效提高工件对激光的吸收率,增加焊缝热输入,最终显著提高升温速率和峰值温度。涂敷NaF活性剂并没有提高焊接温度,这是由于焊接过程的化学冶金反应需要适量的S(硫)、O元素才能与不锈钢中的合金元素以及杂质元素完成氧化反应,以达到增加焊缝热输入的目的,涂敷NaF活性剂不仅没有这一作用,活性剂还有一定的绝缘层作用,因此焊接温度会略微降低[13-14]

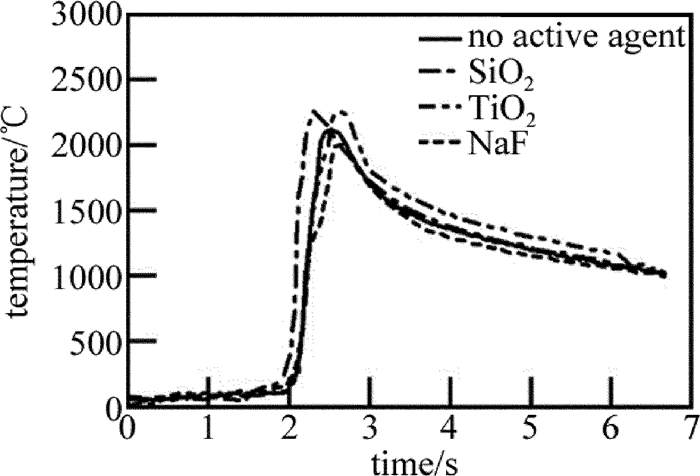
  • 图 6为焊接试验结束时经红外热像仪实时监测到的各试样上的温度分布情况。由图可见,高温区集中在焊缝处,温度分布沿焊接方向递增,沿焊缝中心向左右两侧递减。焊缝上表面的靠近激光光源中心位置的温度最高。其中,未涂敷活性剂试样的最高温度为2018.2℃,涂敷SiO2活性剂试件的最高温度为2176.2℃,涂敷TiO2活性剂试件的最高温度为2039.8℃,涂敷NaF活性剂试件的最高温度为1988.2℃。这是由于激光焊接热源属于高能束热源,激光束的能量输入、热传导、材料的汽化和熔化等均会影响焊接熔池的温度变化,活性剂的涂敷改变了焊接传热效应,从而影响了熔池峰值温度[15]图 7为熔池中某一点在各个试件同一位置的温度变化曲线。如图所示,试验监测的温度曲线的变化趋势、峰值温度以及升温速率和模拟结果比较吻合,但两者仍存在一定差异。试验测得的无活性剂试件的峰值温度为2110.3℃,涂敷SiO2活性剂试件的峰值温度为2293.01℃且升温速率最快,涂敷TiO2活性剂试件的峰值温度为2261.09℃,涂敷NaF活性剂试件的峰值温度为2007.67℃。与未涂敷活性剂激光焊接试样相比,涂敷SiO2活性剂使峰值温度升高约9%, 涂敷TiO2活性剂使峰值温度升高约7%,涂敷NaF活性剂使峰值温度降低约5%。

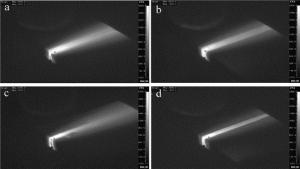
    Figure 6.  Temperature monitoring data results

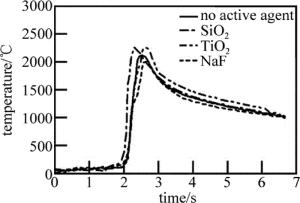
    Figure 7.  Test monitoring temperature change curve of selected points on melting pool of each specimen

  • 图 8为各试样熔池同一位置某一点温度的模拟计算与试验监测数据在峰值温度附近的拟合对比情况。由图 8可见,两者温度的变化趋势大致相似,但升温速度和峰值温度略有不同。试验曲线的前半部分升温速率较为平缓,后半部分升温速率增大直到达到峰值温度;模拟曲线升温部分的前半段升温速率与试验曲线相似,升温部分的后半段则近似垂直于时间轴,几乎在热源到达选取点瞬间温度上升至最高值。对比试验结果的峰值温度,模拟计算的未涂敷活性剂试件的峰值温度约提升了24%,涂敷SiO2活性剂试件的峰值温度约提高了24%,涂敷TiO2活性剂试件的峰值温度约提高了25%,涂敷NaF活性剂试件的峰值温度约提高了25%。这是因为在模拟计算中对一些复杂的影响因素进行了简化和忽略,例如对热源模型及传热过程进行了简化,对环境中不可控因素如空气流动强度、湿度等进行忽略。此外,红外热像仪与熔池距离的大小也会对实测结果产生一定的影响。这些因素均会导致试验检测结果与数值模拟结果存在一定的误差。由拟合结果基本表明数值模拟具有一定可靠性。

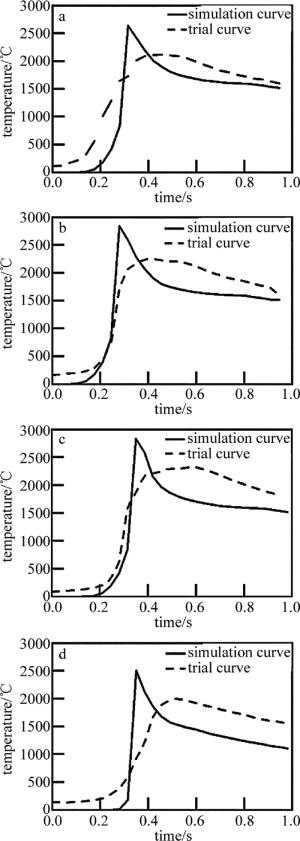
    Figure 8.  Comparison diagram of temperature change trend between simulation calculation and test monitoring at a certain point on the sample

4.   结 论
  • (1) 基于ANSYS软件建立了活性激光焊接的3维有限元模型,通过模拟计算试样熔池温度场, 发现活性剂涂敷并未对温度场分布造成明显影响,但对熔池的峰值温度略有改变。

    (2) 由红外热像仪对焊接过程试样熔池温度分布的实时监测结果表明,活性剂对焊接熔池的升温速率和峰值温度均有不同程度的影响。其中,SiO2的升温速率最大。同时,SiO2和TiO2活性剂使峰值温度升高约7%~9%,NaF活性剂使峰值温度降低约5%。

    (3) 结合数值模拟与试验监测结果,发现两者的温度变化趋势较相近,考虑模拟计算对热源模型及传热过程的简化均会导致模拟结果的升温速率加快、峰值温度更高(约24%~25%),由此可见,数值计算结果与试验检测结果吻合较好,模拟计算结果可靠。

Reference (15)

Catalog

    /

    DownLoad:  Full-Size Img  PowerPoint
    Return
    Return