 Map
Map


HTML
-
煤炭是传统工业以及人们生活的主要能源之一, 煤质优劣与非金属元素含量密切相关。煤是一种复杂混合物[1],煤中主要元素为碳(C)、氢(H)、氧(O)、氮(N)、硫(S)等非金属元素,它们约占煤总量的95%以上。迫切需要对煤中非金属元素含量进行快速检测。一方面,煤中非金属元素含量与煤的工业指标有着密不可分的联系,快速煤质分析有利于煤炭资源的有效利用;另一方面,对煤中非金属元素的快速、灵敏、精确测量,对开发新能源,实现我国资源的合理利用有着长足的意义。
激光诱导击穿光谱技术(laser-induced breakdown spectroscopy,LIBS)作为一种新型物质分析技术,在物质分析、元素检测领域发展迅速,其操作较为容易、仅需简单样品处理, 可同时分析多种元素, 具有较高的灵敏度。LIBS技术当前广泛应用于工业分析[2-5]、环境监测[6]、地矿分析[7-8]、医学鉴定[9]、农业[10]和食品安全[11-12]等领域。
1991年,OTTESEN等人[13]应用LIBS技术激发煤粉,并识别出了C,H,O,N等多种非金属元素和Na,K,Mg,Ca等多种金属元素的特征谱线。YAO等人主要研究了收光模式[14]、收光角度[15]、激光能量[16]、环境气氛[17-18]、煤粉粒子直径[19]、粘合剂[20]等实验参量对煤的工业指标测量的影响,并将LIBS应用于煤的工业分析[21-23],分析了激光诱导煤等离子体的演化特征及影响因素[24-26],以及多元定标法[22, 27]等不同的定标模型的定量分析。WNAG等人采用LIBS技术研究煤的工业指标,主要采用LIBS技术联合偏最小二乘(partial least squares, PLS)模型[28-31]用于煤质分析。已有的研究大多着重于将LIBS用于分析煤的工业指标,LIBS技术在煤中无机非金属元素的检测研究较少。煤的工业分析与元素分析分别从不同角度反映煤的性质,煤的结构决定其性质,煤的元素组成直接影响煤的工业分析指标[32],因此, 研究煤的元素含量分析是很有必要的。
LIBS定量分析的基础是建立谱线强度与元素含量之间的回归关系。定标曲线法和内标法是LIBS定量分析中最基本的方法。定标曲线法主要依据Lomakin-Schiebe公式,建立待测元素的某条特征谱线强度与所测元素含量之间的线性回归关系,再由待测物质的光谱强度信息反推即可得到浓度信息[33];内标法[34]利用待测元素的某条特征发射谱线强度与某种浓度已知元素的谱线强度之比来进行标准化校正。这两种方法无法有效地消除谱线干扰、基体效应和自吸收效应的影响,且会造成其它有效光谱波段的信息丢失,使得LIBS分析精度不足,它们也不能满足多元素同步测量的实际需要。
为了提高LIBS定量分析的重复性和准确性,并实现煤中非金属元素的多元素同步测量,本文中采用LIBS实验系统对9个煤的国家标准样品进行激光诱导击穿实验,其中6个用于模型训练,3个用于预测,将化学计量学中的偏最小二乘回归(partial least squares regression, PLSR)用于定标模型建立,用188.885nm~308.008nm和655nm~660nm波长范围的光谱数据用于定量分析,研究PLSR结合LIBS用于快速、同时、多元素分析的可行性。结果表明,使用LIBS结合PLSR能够实现对煤中非金属元素的同步检测。
-
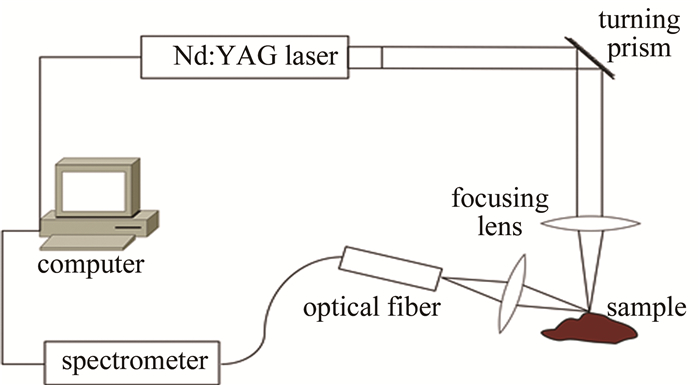
实验中用来激发等离子体和接收等离子体光谱的仪器为美国TSI公司的ChemReveal台式激光诱导击穿光谱仪。此仪器采用一体化设计,集成激光器、光谱仪和样品仓于一体。一体机的激光器为Nd: YAG激光器,波长为1064nm,脉冲宽度为5ns~10ns;Echelle中阶梯ICCD高分辨率光谱仪,分辨率小于0.01nm,延迟时间为0ms~10ms,调整分辨率100ns。LIBS系统简图如图 1所示。

Figure 1. LIBS experimental system
-
实验中所用煤样品为泉东标准物质研究所提供的煤质分析国家标准物质,将9个标样用20MPa液压机压制成直径为30mm、厚度为3mm的圆饼,这9个煤样品的主要工业指标和元素组成如表 1所示。
sample C H S GBW(E)110026 0.6498 0.0432 0.0404 GBW(E)110028 0.7565 0.0403 0.0028 GBW(E)110030 0.7518 0.049 0.0182 GBW(E)110031 0.8132 0.0351 0.0281 GBW(E)110032 0.6015 0.0389 0.0219 GBW(E)110033 0.5708 0.0388 0.0167 GBW(E)110034 0.7355 0.048 0.0143 GBW(E)110035 0.7709 0.0415 0.005 GBW(E)110038 0.6475 0.0204 0.0177 Table 1. Mass fraction of C, H and S in 9 kinds of coal national standard samples
-
实验中,为了避免样品污染,首先对压成的饼状煤样品表面用激光进行表面清洗,为了减少LIBS系统实验参量的影响,在每个煤样品表面取9个点,每个点重复激发11次,即每个煤样品获取99个光谱数据,最后取光谱数据的平均值作为每个样品的光谱数据。同时,为了得到高信噪比的特征谱峰,对实验参量进行优化,主要实验参量如下:脉冲激光能量为80mJ,脉冲频率为10Hz,光谱采集延迟时间为5μs,激光光斑直径为100μm。样品在空气环境下激发,用激光激发煤样品得到谱线信息后,用光谱仪采集光谱信号,得到188.885nm~980.391nm波长范围激光诱导击穿光谱。
1.1. LIBS实验系统
1.2. 实验样品
1.3. 实验参量设置
-
PLSR由WOLD和ALBANO在1984年提出[35],该算法相比于其它多元线性回归方法,很好地解决了其它方法面临的样本点数过少的回归难题或变量之间存在多重相关性的问题。本文中将PLSR用于LIBS分析的原因,一是其考虑了基体效应、随机噪声、光谱干扰和自吸收的影响,这些因素可以在光谱矩阵分解提取中得到消除,另一个原因是本文中样本数量较少。
假设有n个训练样品,光谱矩阵X ={x1, x2, …, xm}为自变量,元素含量构成的数据矩阵Y ={y1, y2, …, yp}为因变量,为研究它们之间的回归关系,首先分别在X与Y中提取出成分t1和u1,t1和u1分别是X和Y的线性组合。
对提取的两个主成分要求如下[36]:(1)t1和u1应最大限度包含光谱矩阵和质量分数矩阵X, Y的变异信息;(2)t1和u1具有最大相关性。
提取主成分t1和u1后,做X对t1的回归以及Y对u1的回归,并检验模型的精度。满意则算法终止; 如果精度不满足要求,则用X对t1解释后的残差矩阵和Y对t1解释后的残差矩阵重新提取主成分,直到达到精度满足要求。
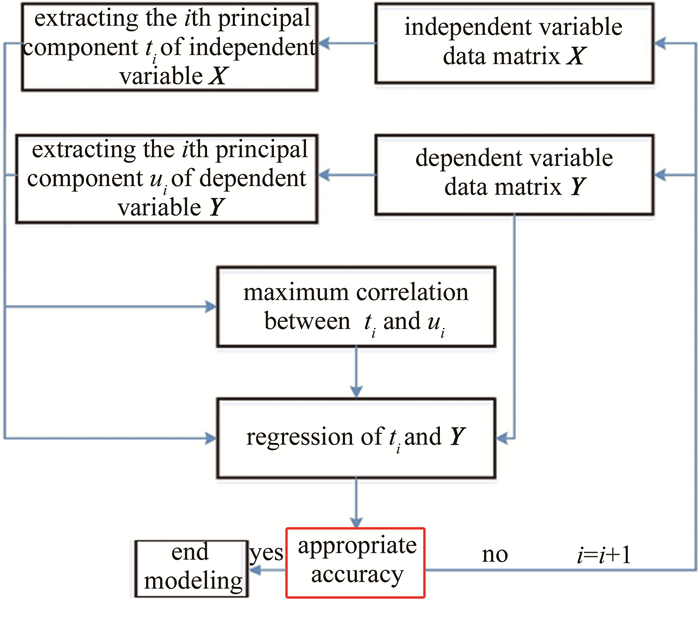
假设X最终共提取了q个成分t1, t2, …, tq,PLSR做Y对t1, t2, …, tq的回归分析,最终得到质量分数矩阵Y ={y1, y2, …, yp}关于光谱矩阵X ={x1, x2, …, xm}的回归方程。PLSR建模过程如图 2所示。
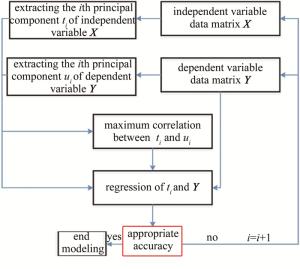
Figure 2. Modeling process of partial least squares regression
-
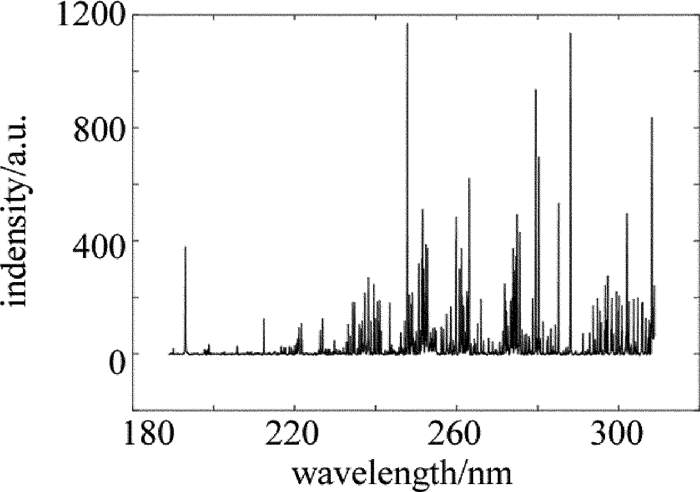
实验中所用9个煤样品, 基质组成相似,188.885nm~980.391nm范围内光谱特征谱线位置大致相同。图 3a为GBW(E)110026的LIBS光谱。

Figure 3. LIBS spectrogram of GBW(E)110026
由图可知,光谱在350nm~980.391nm波长范围内谱线十分拥挤,且有变化复杂的背景信号;由于光谱范围较大,且部分波段谱线密集,为了降低运算量,选取188.885nm~308.008nm波长范围LIBS光谱如图 3b所示,对比美国NIST原子光谱数据库,该波段包含常用的C、S谱线,还识别出N, Fe, Mn, Al等元素的特征谱线,且谱线信号质量较好,因此选择该波段分析;由美国NIST原子光谱数据库可知,H元素较为常用的分析谱线为H Ⅰ 656.279nm,为了分析H元素,增加655nm~660nm波长范围的光谱信号用于分析。为了减少背景噪声和实验参量的影响,首先用迭代形态学不对称重加权最小二乘法[37]对光谱数据进行基线校正处理,基线校正后的光谱图如图 4所示。以表 1中前6个样品的光谱数据用于训练PLS模型,后3个样品用于模型预测以验证模型的性能。

Figure 4. LIBS spectra of GBW(E)110026 after baseline correction
-
为了验证PLSR模型的预测精度,用以下几个指标来判断模型的预测能力。
(1) 决定系数R2:
式中,SSSR为残差平方和(sum of squares of residuals, SSR),SSSD为总偏差平方和(sum of squares of total deviation, SSD)。
式中,n为样本个数,yi是观测值,${{\hat y}_i} $为预测值,${\bar y} $为观测值的均值。
R2越接近于1,表示光谱信号与元素含量之间相关度越好,回归效果越显著;R2>0.7,表示数据得到可信的表示;R2>0.9,说明拟合效果很好。
(2) 校正均方根误差(root mean square error of ca-libration, RMSEC):
式中,nc为建模样本数。
(3) 预测均方根误差(root mean square error of prediction, RMSEP):
式中,np为预测样本数。
(4) 平均相对误差(average relative error, ARE):
-
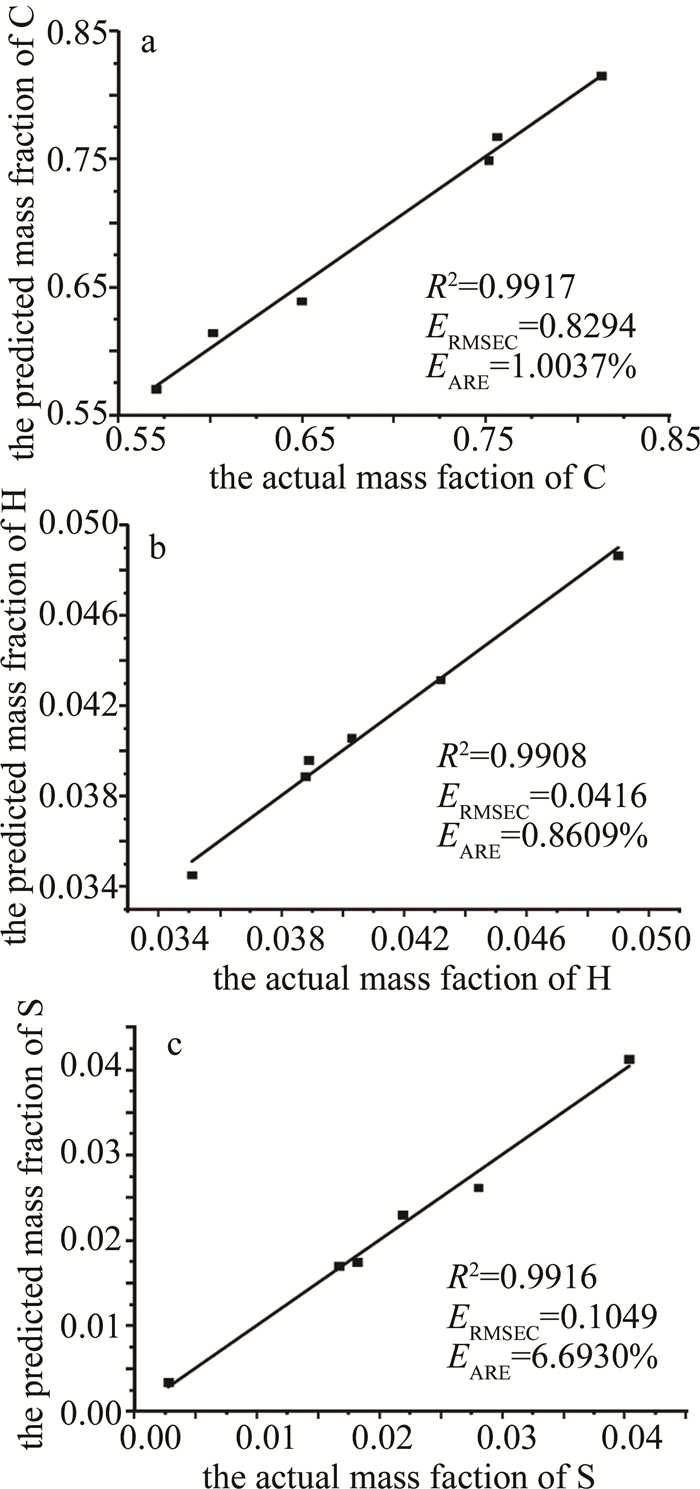
PLSR建模过程如第2节中所述,将表 1中前6个样品基线校正后的188.885nm~308.008nm和655nm~ 660nm波长范围谱线强度值构成的光谱矩阵X和元素质量分数矩阵Y作为模型的输入量,建立这几种元素的定标模型, 并将表 1中后3种样品用于含量预测。模型的预测质量分数与观测质量分数的PLSR校正模型如图 5所示。由图可知,C, H, S 3种元素校正模型的决定系数R2分别为0.9917,0.9908, 0.9916,校正均方根误差ERMSEC分别为0.8294, 0.0416, 0.1049,平均相对误差EARE分别为1.0037%, 0.8609%, 6.6930%。数据表明, 定标样本的真实质量分数与LIBS预测质量分数具有良好的拟合关系,建立的模型质量较好。
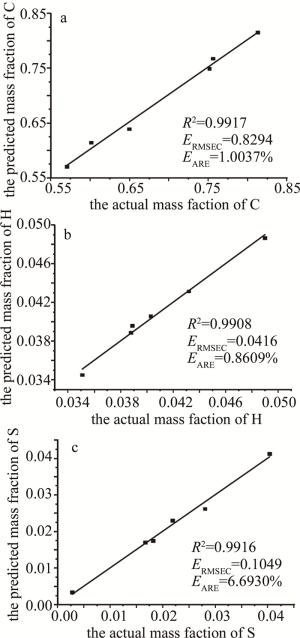
Figure 5. PLSR calibration model for the actual and predicted element concentration of samples with different R2, ERMSEC, EARE
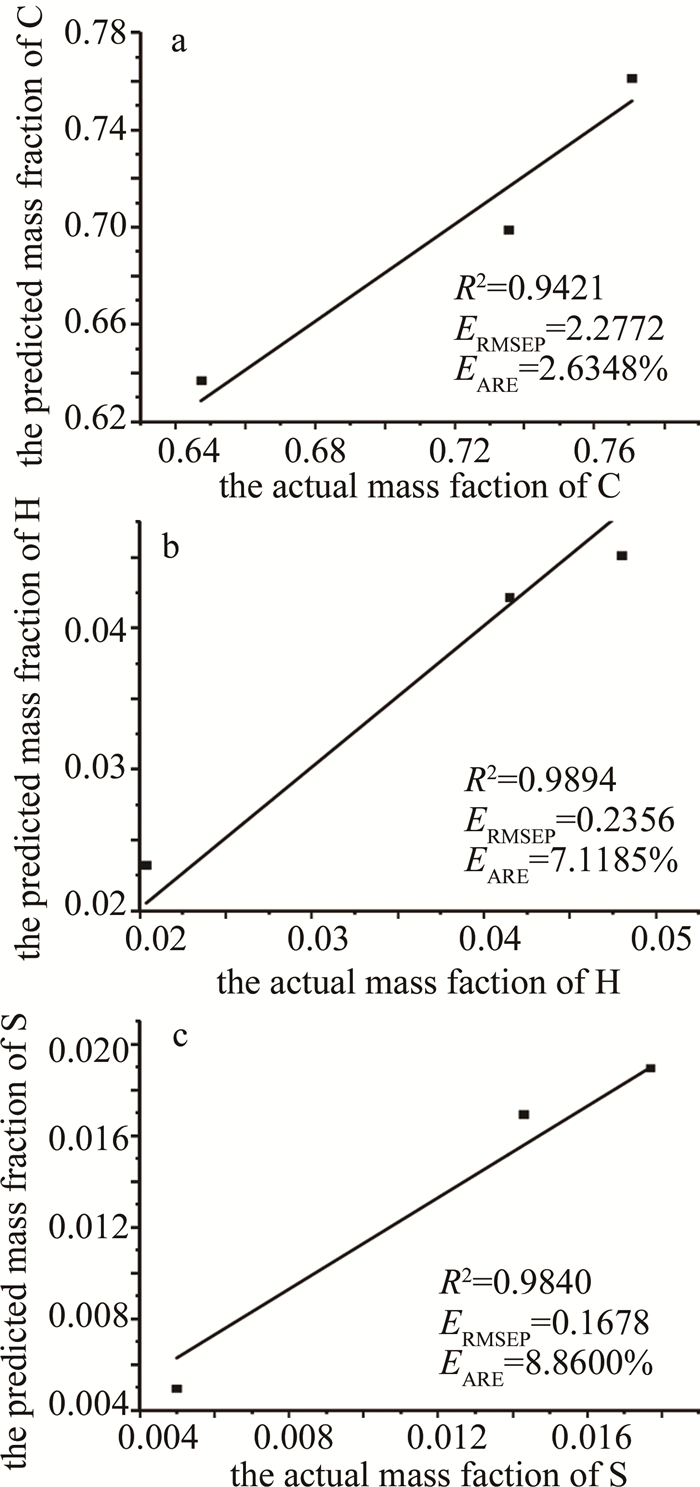
为了判断模型的可靠性,用模型进行后3种样品元素含量预测,预测模型及结果如图 6所示。C, H, S决定系数R2分别为0.9421, 0.9894, 0.9840,预测均方根误差ERMSEP分别为2.2772, 0.2356, 0.1678,平均相对误差EARE分别为2.6348%, 7.1185%, 8.8600%。
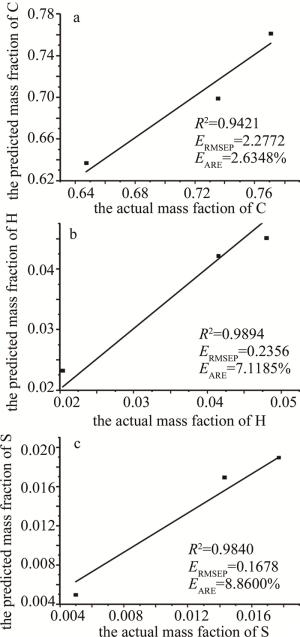
Figure 6. PLSR prediction model for the actual and predicted element concentrations of samples with different R2, ERMSEP, EARE
结果表明,模型的预测值与真实值平均相对误差在9%以内,模型具有可信的预测精度。
3.1. 煤LIBS光谱特征

3.2. 模型评价指标
3.3. PLSR建模及结果验证
-
利用LIBS技术对9种煤标准样品的C, H, S元素进行定量分析,为了实现同步测量,采用偏最小二乘回归构建定标模型,选择188.885nm~308.008nm和655nm~660nm波长范围激光诱导击穿光谱用于模型训练,C, H, S 3种元素校正模型的决定系数R2分别为0.9917, 0.9908, 0.9916,校正均方根误差分别为0.8294, 0.0416, 0.1049,平均相对误差分别为1.0037%, 0.8609%, 6.6930%。用3个煤样验证模型的可靠性,得到的C, H, N, S元素的预测质量分数与真实质量分数的决定系数R2分别为0.9421, 0.9894, 0.9840,预测均方根误差分别为2.2772, 0.2356, 0.1678,平均相对误差分别为2.6348%, 7.1185%, 8.8600%。结果表明,结合偏最小二乘回归的LIBS技术能够用于煤中多种非金属元素同步检测,该方法可以推广到其它物质的元素同步检测,也为LIBS技术的快速、高精度分析提供一定的理论指导。
 DownLoad: