Advanced Search

ISSN1001-3806 CN51-1125/TN Map

Volume 43 Issue 5
Sep.  2019
Article Contents
Turn off MathJax

Citation:

Nondestructive detection of apple defect combining optical fiber spectra with pattern recognition

  • Received Date: 2018-11-15
    Accepted Date: 2018-11-27
  • In order to prove that the non-destructive detection of apple surface defect combining optical fiber spectroscopy with pattern recognition was effective, an optical fiber spectrum acquisition system was used to collect spectral data of apples with and without surface defect. Standard normal variation (SNV) and first derivative were used to preprocess the original spectral data. Principal component analysis (PCA) was used to reduce the dimension of the pre-processed spectral data to extract the characteristic spectra of apples with surface defect. By using k nearest neighbor (KNN) pattern recognition method and partial least squares discriminant analysis method, recognition model of apple defect was established. The results show that, the first eight principal components with cumulative contribution over 99% are selected as the characteristic spectral data of the sample set by using principal component analysis and the dimensionality reduction of spectral data is well realized. By using first order derivative+KNN recognition model for correction set and SNV+KNN recognition model for prediction concentration, the recognition rate of normal apples and defected apples is 96.0%. The feasibility of non-destructive detection of apple surface defect based on optical fiber spectroscopy and pattern recognition is verified.
  • 加载中
  • [1]

    GUO W Ch, WANG M H, GU J S, et al. Identification of bruised kiwifruits during storage by near infrared spectroscopy and extreme learning machine[J]. Optics and Precision Engineering, 2013, 21(10): 2720-2727 (in Chinese). doi: 10.3788/OPE.20132110.2720
    [2]

    ZHENG C Y, GUO Zh H, JIN L. Measurement of total viable count on chilled mutton surface based on hyperspectral imaging technique[J]. Laser Technology, 2015, 39(2): 284-288 (in Chinese).
    [3]

    ZOU X B, SHEN T T, SHI J Y, et al. Discrimination on maturity of plums based on hyperspectral imaging information[J]. Modern Food Science and Technology, 2016, 32(4): 235-240 (in Chinese).
    [4]

    ZHAO F, DONG J L, GUO W Ch. Effect of spectral extraction regions in hyperspectral images on the precision in determining the sugar content of kiwifruits [J]. Modern Food Science and Technology, 2016, 32(4): 223-228 (in Chinese).
    [5]

    GUO W Ch, ZHAO F, DONG J L. Nondestructive measurement of soluble solids content of kiwifruits using near-infrared hyperspectral imaging[J]. Food Analytical Methods, 2016, 9(1): 38-47. doi: 10.1007/s12161-015-0165-z
    [6]

    LI L L, WANG B, ZHANG X H, et al. Discrimination on maturity of plums based on hyperspectral imaging information[J]. Modern Food Science and Technology, 2017, 33(12): 228-232 (in Chinese).
    [7]

    ERKINBAEV C, HENDERSON K, PALIWAL J. Discrimination of gluten-free oats from contaminants using near infrared hyperspectral imaging technique[J]. Food Control, 2017, 80: 97-203.
    [8]

    MO C, KIM G, KIM M S, et al. Fluorescence hyperspectral imaging technique for foreign substance detection on fresh-cut lettuce[J]. Journal of the Science of Food & Agriculture, 2017, 97(12): 3985-3993.
    [9]

    SONG X Sh, CHEN G Q, ZHU Zh W, et al. Determination of vo-lume fraction of acid in Chinese aged liquor by 3-D fluorescence spectrometry[J]. Laser Technology, 2018, 42(4):531-535 (in Chin-ese).
    [10]

    YIN X H, JIANG Y, LV B Ch, et al. Quantitative analysis of 2-mercaptobenzothiazole based on terahertz time-domain spectroscopy[J]. Laser Technology, 2019, 43(1):1-9 (in Chinese).
    [11]

    PU H B, LIU D, WANG L, et al. Soluble solids content and pH prediction and maturity discrimination of lychee fruits using visible and near infrared hyperspectral imaging[J]. Food Analytical Methods, 2016, 9(1): 235-244. doi: 10.1007/s12161-015-0186-7
    [12]

    SIEDLISKA A, BARANOWSKI P, ZUBIK M, et al. Detection of pits in fresh and frozen cherries using a hyperspectral system in transmittance mode[J]. Journal of Food Engineering, 2017, 215: 61-71. doi: 10.1016/j.jfoodeng.2017.07.028
    [13]

    LIU Y D, WU M M, LI Y F, et al. Comparision of reflection and diffuse transmission for detecting solid soluble contents and ratio of sugar and acid in apples by on-line vis/NIR spectroscopy[J]. Spectroscopy and Spectral Analysis, 2017, 37(8): 2424-2429 (in Ch-inese).
    [14]

    LIU Y D, XU H, SUN X D, et al. Non-destructive measurement of tomato maturity by near-infrared diffuse transmission spectroscopy[J]. Laser Technology, 2019, 43(1): 25-29 (in Chinese).
    [15]

    ZHAO J, PENG Y K, ZHAO S W, et al. Detection of defects in apples based on hyperspectral imaging technology[J]. Journal of Food Safety and Quality, 2012, 3(6): 681-684 (in Chinese).
    [16]

    TIAN Y W, CHENG Y, WANG X Q, et al. Recognition method of insect damage and stem/calyx on apple based on hyperspectral imaging[J]. Transactions of the Chinese Society of Agricultural Engineering, 2015, 31(4): 325-331 (in Chinese).
    [17]

    ZHANG B F, YUAN L B, ZHANG B X. Study on prediction total acid and soluble sugar of tomato juice by near infrared optical fiber spectrometer technique[J]. Spectroscopy and Spectral Analysis, 2014, 34(2): 350-353 (in Chinese).
    [18]

    NI L J, ZHANG L G. Basic chemometrics and its application[M]. Shanghai: East China University of Science and Technology Press, 2011: 64-69(in Chinese).
    [19]

    LI Y, GUO J X, MUHETAER M, et al. Effect of spectral data pretreatment on visible/near infrared spectroscopy model of soluble so-lids content of apples[J]. Northern Horticulture, 2016, 20: 1-4 (in Chinese).
    [20]

    HUANG W Q, CHEN L P, LI J B, et al. Effective wavelengths determination for detection of slight bruises on apples based on hyperspectral imaging[J]. Transactions of the Chinese Society of Agricultural Engineering, 2013, 29(1): 272-277 (in Chinese).
  • 加载中
通讯作者: 陈斌, bchen63@163.com
  • 1. 

    沈阳化工大学材料科学与工程学院 沈阳 110142

  1. 本站搜索
  2. 百度学术搜索
  3. 万方数据库搜索
  4. CNKI搜索

Figures(5) / Tables(2)

Article views(6419) PDF downloads(22) Cited by()

Proportional views

Nondestructive detection of apple defect combining optical fiber spectra with pattern recognition

  • 1. Food and Pharmaceutical Engineering Institute, Guiyang University, Guiyang 550005, China
  • 2. Research Center of Nondestructive Testing for Agricultural Products, Guiyang University, Guiyang 550005, China

Abstract: In order to prove that the non-destructive detection of apple surface defect combining optical fiber spectroscopy with pattern recognition was effective, an optical fiber spectrum acquisition system was used to collect spectral data of apples with and without surface defect. Standard normal variation (SNV) and first derivative were used to preprocess the original spectral data. Principal component analysis (PCA) was used to reduce the dimension of the pre-processed spectral data to extract the characteristic spectra of apples with surface defect. By using k nearest neighbor (KNN) pattern recognition method and partial least squares discriminant analysis method, recognition model of apple defect was established. The results show that, the first eight principal components with cumulative contribution over 99% are selected as the characteristic spectral data of the sample set by using principal component analysis and the dimensionality reduction of spectral data is well realized. By using first order derivative+KNN recognition model for correction set and SNV+KNN recognition model for prediction concentration, the recognition rate of normal apples and defected apples is 96.0%. The feasibility of non-destructive detection of apple surface defect based on optical fiber spectroscopy and pattern recognition is verified.

引言
  • 苹果因其含有丰富的维生素,居世界四大水果(苹果、葡萄、柑桔和香蕉)之冠。然而,在苹果的生长过程中,经常会受到各种因素的影响导致苹果表面出现疤痕,从而影响苹果的外观,甚至使其丧失了可食性,极大地影响了苹果的品质和销售。由此可见,对新鲜苹果的表面疤痕检测尤为重要。传统的检测方法大多是人工操作,耗时耗力,而且效率低,无法满足大规模生产的需求。因此,开发研制一种快速、无损、高效的苹果表面疤痕检测方法在水果检测领域中具有较好的应用前景。近年来,基于光谱技术的无损检测技术以其高效、无损、可实时在线检测等诸多优点受到科研工作者的广泛关注,被广泛应用于食品、医药和化工等各个领域[1-10]。国内外研究学者对水果的品质检测分析主要集中在水果内部品质的定量检测方面[11-14],而在水果外部品质(早期损伤、表面缺陷等)检测方面的研究相对较少。ZHAO等人[15]利用高光谱技术检测苹果外观缺陷,基于主成分分析(principal component analysis,PCA)法检测苹果表面缺陷的分级准确率为81.25%,而采用波段比率算法对苹果表面缺陷的分级准确率为93.75%。TIAN等人[16]采用支持向量机对苹果虫伤区域和正常区域、果梗/花萼区域进行识别,总体识别率为97.8%。ZHANG等人[17]应用近红外光谱技术与光纤传感技术相结合的新方法,快速测量了西红柿果浆样品中营养成分的含量,采用偏最小二乘法进行回归,建立了西红柿果浆中总酸及可溶性糖含量的数学模型,均达到了较好的预测结果。目前,基于光纤光谱技术结合模式识别方法对水果表面疤痕的研究鲜有报道。

    因此,本文中以“红富士”苹果为研究对象,收集完好无损和表面有疤痕苹果样本随机分配,建立校正样本集和预测样本集;利用光谱采集系统采集校正样本集和预测样本集中苹果样本的光谱反射率,得到校正和预测样本集原始光谱数据;并采用标准正态变换(standard normal variation,SNV)和1阶导数对原始光谱数据进行预处理,进而利用PCA法对预处理后的光谱数据进行降维,以提取能反映苹果表面疤痕的特征光谱,建立校正和预测样本集特征数据;最后,利用偏最小二乘判别分析方法和k最近邻(k nearest neighbor,KNN)模式识别方法分别建立了苹果表面疤痕的识别模型。实现了对苹果表面疤痕的快速、无损识别。

1.   材料与方法
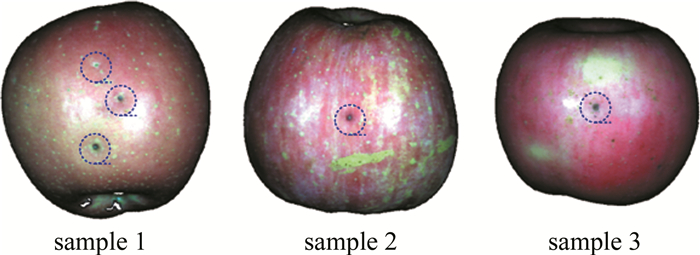
  • 以“红富士”苹果作为实验研究对象。实验中所用苹果购买于当地的沃尔玛超市,买回后挑选一批大小均匀、完好无损和表面有疤痕苹果样本(共200个)随机分配,建立校正样本集(150个)和预测样本集(50个)。图 1为表面有疤痕苹果样本的图像信息。从图 1可以看出,苹果表面部分疤痕的颜色较深,可以通过人眼识别出,而部分表面疤痕不明显的样本与正常苹果样本难以区分,仅凭外部图像信息是很难识别出这类表面有疤痕的苹果。

    Figure 1.  Images of apples with surface defect

  • 本实验中采用光纤光谱采集系统来获取苹果样本的光谱反射率,光纤光谱采集系统如图 2所示。该系统主要包括:高性能光谱仪QEPro(海洋光学)、光纤R600-7-VIS-125F(由7股光纤紧紧捆扎在一起组成,套环为不锈钢材质,其中6股为照明光纤,中间的1股为读出光纤,光纤的直径600μm)、卤钨灯光源HL-2000、标准反射白板WS-1、反射探头支架RPH-1(用于固定反射探头的表面镀铝的探头架,反射探头与表面呈90°)和RPH-ADP适配器(用于使探头适合于RPH-1型探头架,使探头架可以固定直径为3.17mm的探头)以及计算机。反射探头通过RPH-ADP适配器固定在反射探头支架RPH-1上,距离反射探头支架表面约1cm,将苹果样本贴在反射探头支架RPH-1表面上,使反射探头对准苹果表面完好无损区域以及表面有疤痕区域,通过多次测量求平均值测量苹果样本的光谱反射率,采集得到完好无损和表面有疤痕苹果的光谱数据并将其作为校正集和预测集光谱数据,所得光谱数据以文本形式存入计算机内。系统的积分时间是110ms,多次扫描平均次数为8,滑动平均宽度为1。光谱采集范围为198.2nm~1006.4nm,光谱波段为1044个。在实际应用中,可以将苹果样本放在旋转的支架上来采集整个苹果表面的光谱信息,实现苹果表面疤痕的无损检测。

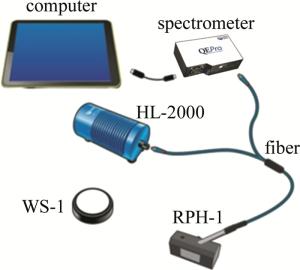
    Figure 2.  Schematic diagram of a spectrum acquisition system

  • 常见的光谱数据预处理方法包括:标准正态变换(SNV)和1阶导数等[18]。其中SNV预处理方法常用来校正光谱数据中因散射而引起的误差,具体处理方法是原光谱数据减去该光谱数据所有光谱反射率的平均值后,再除以该光谱数据的标准偏差,进而使原光谱数据实现标准正态化;而1阶导数预处理方法可以消除光谱数据中存在的线性背景平移。本实验在MATLAB R2016b软件中实现光谱数据的预处理。

  • PCA法是一种经常采用的有效信息提取方法,该方法从样本集构成的变量协方差矩阵出发,通过特征分解来获取方差最大的虚拟主成分进而代替原始变量,最终得到新的变量(主成分得分)。PCA法可有效地消除原始光谱数据中存在的信息冗余,进而得到所需要的特征光谱数据。

    偏最小二乘判别分析(partial least square discrimination analysis,PLS-DA)方法和KNN法是模式识别中经常使用的有监督统计模式识别方法[18]。其中PLS-DA法将样品的特征数据看作自变量X、样品的类别信息作为因变量YY是一个以0,1为元素的矩阵,当样品属于某一类时,则该样本在Y中对应列的元素值为1,否则为0。PLS-DA将XY的每一列数据分别进行偏最小二乘回归分析,进而得到类别信息矩阵,最后根据该类别信息矩阵的每一列数据与1接近的程度判别样本属于哪类。而KNN方法的基本思想是:首先将提前分好类别的训练样本集“记入”多维空间中;然后,再将待分类的未知样本集点亦记入空间;最后,通过考察未知样本样点的k个近邻,如果近邻某一类样本最多,则可将该未知样本归为这一类。

  • 校正集和预测集样本的光谱反射率采集过程由OceanView(Ocean Optics,copyright 2013)软件控制,并采用MATLAB R2016b软件实现对样本原始光谱数据的处理以及识别模型的建立。

2.   结果与分析
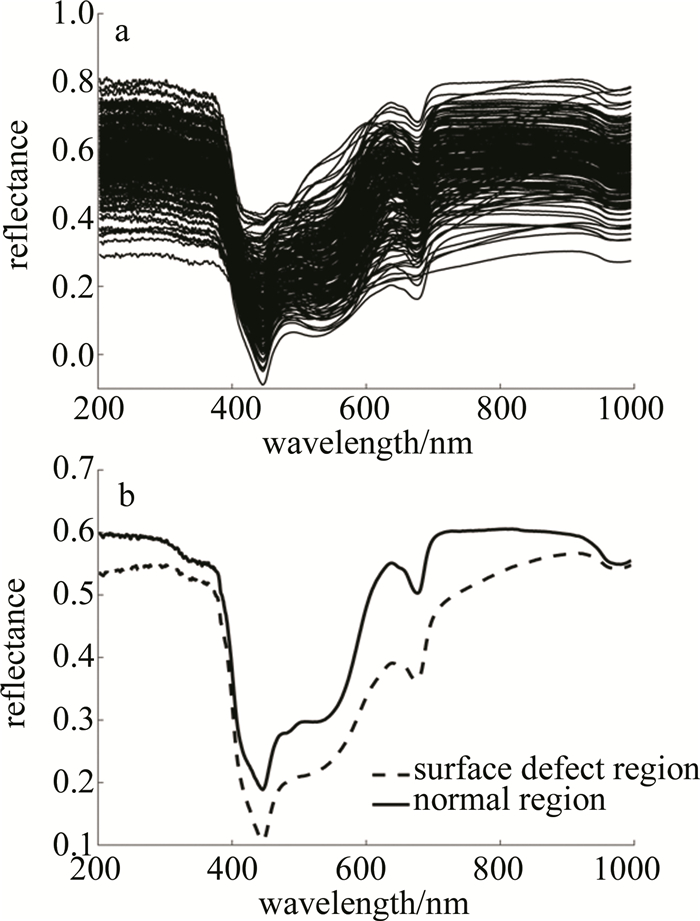
  • 由于原始光谱的起始端和末端有较大的噪声,为了消除噪声的影响,选择波长204.7nm~997.6nm为有效的光谱区域,该区域有1024个波段,去除噪声的苹果疤痕区域和正常区域的光谱反射率曲线如图 3所示。其中图 3a为200个苹果样本的光谱反射率,图 3b为苹果表面疤痕区域和正常区域的平均光谱反射率曲线。整体上来看,完好无损和表面具有疤痕苹果的平均光谱曲线的变化趋势基本一致,在400nm~700nm波段内,光谱反射率呈现出由低→高→低的趋势,即在蓝光波段430nm~500nm低,黄绿波段520nm~590nm高,橙红波段600nm~680nm低[19]。在680nm~710nm波段内急剧上升,在720nm~930nm波段内平均光谱反射率较高,在930nm~1000nm波段出现吸收谷。在450nm和675nm处具有明显的吸收峰,主要由苹果表面叶绿素的吸收引起的,反映了苹果的表面颜色信息,而980nm处的吸收峰则主要由苹果中的水分吸收所引起的,反映了苹果的水分含量信息[20]。然而,由于完好无损和表面具有疤痕苹果表面叶绿素含量以及水分含量的不同,导致完好无损和表面具有疤痕苹果的平均光谱反射率在400nm~1000nm波段内存在较大的差异。因此, 根据此光谱差异建立识别模型进而识别苹果表面疤痕。

    Figure 3.  Spectral reflectance curves of apples

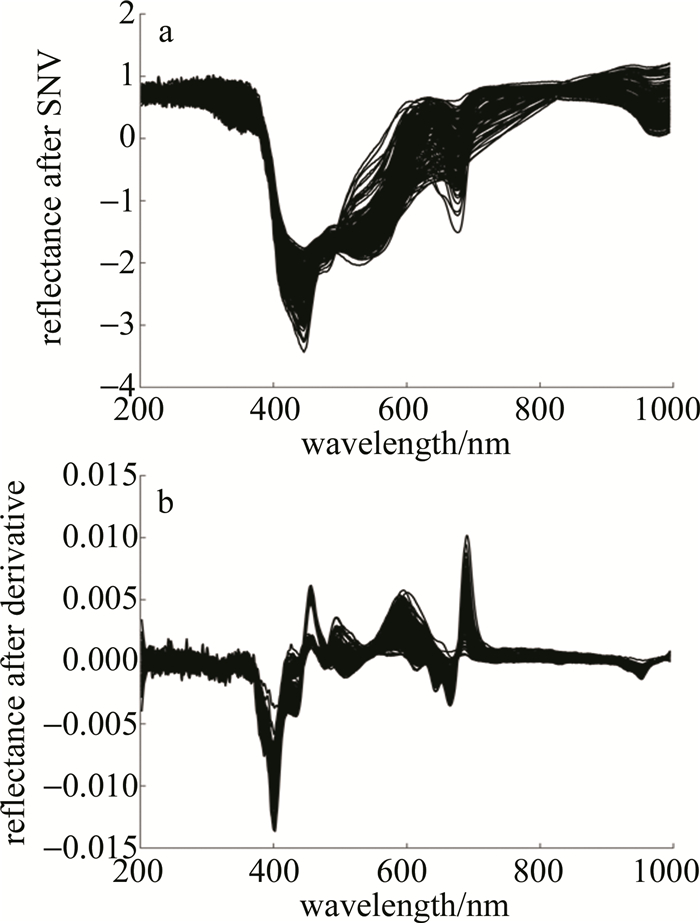
  • 在建立识别模型之前需对原始光谱数据进行预处理,以减少噪声的干扰,提高模型的识别准确率和稳定性。本实验中分别采用了两种光谱预处理方法(SNV和1阶导数)来消除原始光谱数据中的噪声,获得更高信噪比的光谱,以助于后续建立识别模型的稳健性和识别结果的扩展性。经过SNV和1阶导数处理后的光谱反射率曲线如图 4所示。将获得预处理后的光谱数据导入MATLAB软件中建立相关模型。

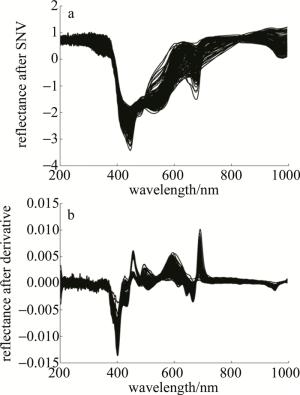
    Figure 4.  Reflectance spectra

  • 将SNV和1阶导数处理后的光谱数据进一步经PCA变换后的第一主成分和第二主成分2维平面分布图如图 5所示。从图中可以发现, 除个别样本是分散开的,总体上分为两类(如图中实线和虚线所示),具有较好的分类结果。经PCA变换后的前8个主成分(P1~P8)得分的贡献率及其累计贡献率见表 1。从表 1可以看出, 前8个主成分(P1~P8)的累计贡献率为99.21%,即可表达99%以上的原始光谱数据的信息。因此,为了提高识别模型的识别准确率,将前8个主成分(P1~P8)作为样本集特征光谱,很好地实现了光谱数据的降维,提高了模型的识别效率。

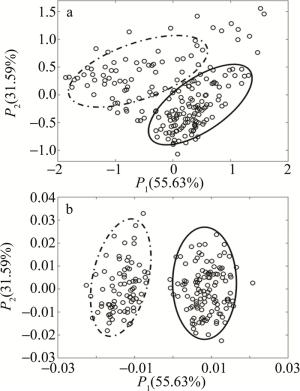
    Figure 5.  Scores scatter plot of P1 and P2

    principal component P1 P2 P3 P4 P5 P6 P7 P8
    contribution rate /% 55.63 31.59 5.86 3.54 2.27 0.55 0.45 0.32
    cumulative contribution rate /% 55.63 87.22 93.08 96.62 97.89 98.44 98.89 99.21

    Table 1.  Contribution rate of principal component score

  • 结合不同的光谱预处理方法以及PCA变换,建立KNN和PLS-DA识别模型,分别对200个实验样本进行识别检测,检测结果见表 2。从表 2可以看出,经过SNV和1阶导数预处理后建立的两种识别模型对校正集和预测集中样本的识别正确率均在92.0%以上,且KNN识别模型的整体识别性能要优于PLS-DA识别模型,其中1阶导数+KNN识别模型对校正集中正常果和疤痕果正确检出144个,正确率高达96.0%,而SNV+KNN识别模型对预测集中正常果和疤痕果正确检出48个,正确率高达96.0%;整体上来看,1阶导数光谱预处理方法具有较好的建模效果,SNV光谱预处理方法具有较好的预测效果。另外,两种识别模型都误将校正集和预测集中的疤痕果识别为正常果,误检的主要原因是部分苹果表面有疤痕的区域较小,利用光纤光谱采集系统收集表面有疤痕区域苹果样本的光谱反射率包含了部分正常区域,为了提高识别正确率,以后要联合多种识别方法完成对水果表面疤痕的检测。

    discriminant models calibration set (150) prediction set (50)
    number rate/% number rate/%
    derivative+KNN 144 96.0 46 92.0
    SNV+KNN 141 94.0 48 96.0
    derivative+PLS-DA 142 94.7 46 92.0
    SNV+PLS-DA 140 93.3 47 94.0

    Table 2.  Discriminant results of KNN and PLS-DA models

3.   结论
  • 利用光纤光谱技术结合模式识别方法建立了苹果表面疤痕的无损检测模型,该模型的预测效果较理想,能够很好地识别出表面有疤痕的苹果。采用SNV和1阶层数光谱预处理方法有效地消除了基线漂移和噪声等对光谱数据带来的干扰;并利用PCA分析方法提取了能反映苹果表面疤痕的特征光谱,得出前8个主成分(P1~P8)可表达99%以上的原始光谱数据信息,并且从第一主成分和第二主成分2维平面分布图中可以发现,除个别样本是分散开的,总体上具有较好的分类结果,很好地实现了光谱数据的降维;最后,建立的KNN识别模型的识别性能要优于PLS-DA识别模型,其中1阶层数+KNN识别模型对校正集以及SNV+KNN识别模型对预测集中正常果和疤痕果的正确率识别均高达96.0%,而且1阶层数光谱预处理方法具有较好的建模效果,SNV光谱预处理方法具有较好的预测效果,这为开发水果表面疤痕在线快速检测系统提供了基础。

Reference (20)

Catalog

    /

    DownLoad:  Full-Size Img  PowerPoint
    Return
    Return