 网站地图
网站地图


-
我国是烟草生产与消费大国,香烟在日常生活中随处可见,在各类刑事案件现场中,常能提取到各种与香烟相关的物证,如烟蒂、烟盒外包装薄膜、烟用内衬纸等,通过对其检验分析,可为公安机关实际办案提供帮助。
烟用内衬纸是包装于卷烟烟支和烟盒之间的纸张,其正反两面分别是金属层(大多数是铝)和纸基层,其纸基层的主要成分为植物纤维[1-3]。目前,检验香烟内衬纸的方法主要有红外光谱法[4]、喇曼光谱法[5-6]、扫描电镜/能谱法[7]和X射线荧光光谱法[8-9]等。GUO等人[10]利用显微共聚焦喇曼光谱对烟用内衬纸的成分做了相关研究,但喇曼光谱信号较弱,易受干扰,且烟用内衬纸样品具有一定的荧光,会对实验结果有一定的影响。作者采用最新的差分喇曼光谱技术对烟用内衬纸样品进行了检验研究,差分喇曼光谱不仅具有无损检材、处理时间短、操作简便的特点,而且能直接测量高荧光物质,滤除干扰峰,抗干扰、抗噪声,大幅度提高系统整体的检测灵敏度和信噪比[11]。
本实验中利用差分喇曼光谱法对44个不同品牌、系列的烟用内衬纸样品进行了检验,采用主成分分析对光谱数据降维,系统聚类分析对样品进行分类,用显著性P值和Pearson相关系数对聚类结果加以评价,并据此建立了判别式,对样品做出区分判定,以期为烟用内衬纸的鉴别分类提供帮助。
-
实验仪器:便携式差分喇曼光谱仪(SEDRS Portable-Base,南京简智仪器设备有限公司)。
实验条件:光源采用双频输出(Δλ≤1nm),单频输出功率不大于450mW,线宽不大于0.06nm;积分时间30s,激光功率为220mW,测量范围180cm-1~2800cm-1。
-
44个不同品牌、不同系列的烟用内衬纸样本信息见表 1。
Table 1. Cigarette liner sample information
number brands and collections 1# Nanjing/Jinling twelve hairpins 2# Nanjing/red China west 3# Nanjing/Nanjing red 4# Nanjing/Jiapin 5# Nanjing/ninth five-year plan 6# Nanjing/Xuan He Men 7# Nanjing/Yuhua stone 8# Golden Leaf/golden hall 9# Golden Leaf/red flag canal 10# Golden Leaf/sky leaf 11# Golden Leaf/small gold 12# Golden Leaf/golden eye 13# Yellow Crane Tower/soft blue 14# Yellow Crane Tower/big choi 15# Yellow Crane Tower/tender valley 16# Yellow Crane Tower/wonderful view 17# Yellow Crane Tower/Yaxiang 18# Yellow Crane Tower/hardsafety 19# Yellow Crane Tower / 1916 Ruanpu 20# Liqun/soft red long mouth 21# Liqun/new edition 22# Liqun/national beauty 23# Yuxi/happy new year 24# Yuxi/hard box 25# Yuxi/soft box 26# Yuxi/original aspiration 27# Changbai Mountain/777 series 28# Marlboro/hard red 29# Marlboro/hard platinum 30# Marlboro/iqos 31# Su Yan/hard gold sand 32# Su Yan/gold sand C 33# Dunhill/blue 34# Yunyan/purple 35# Zhongnanhai/extra high 36# Taishan/luxury 37# Peony/soft export 38# 555/Jin Rui 39# Diamond/lotus 40# Lanzhou/hard boutique 41# Furong King/hard box 42# Double Happiness/boutique 43# Hongtashan/classic 1956 44# Seven Stars/sky blue -
分别剪取收集到的烟用内衬纸样品约0.5cm×0.5cm大小,以纸基面为检测面,在上述实验条件下进行测试,并将数据导入IBM SPSS Statistics 25统计分析软件中进行处理。
-
随机选取13#样品(黄鹤楼/软蓝)和27#样品(长白山/777系列),在13#样品的同一位置平行测试10次,以考查方法的重现性;在27#样品的5个不同位置分别进行测试,以考查样品的均匀性。
-
在进行喇曼光谱分析时,由于喇曼数据信息庞大,变量之间常面临信息重叠的问题,使得分析结果出现偏差,因此常常使用降维手段对数据进行处理,减少数据维数,为模型的建立做铺垫。主成分分析是一种常用的降维方法,在保留原数据主要信息不变的前提下,将多变量问题处理成一组新的相互无关的少数综合变量的问题,可以有效降低多个变量之间的信息重叠,提高分析结果的准确度[12-15]。
-
系统聚类是首先将每个样品单独形成最相似的一类,选定类间距离,计算并比较各类间距离,将距离最小者合并为新的一类,不断重复,直至将所有样品归为一个总类为止。主要的系统聚类方法有最短距离法、中间距离法、离差平方和法等[16-17]。
-
判别分析是判别样品所属类型的一种常用多变量统计分析方法,在具有确切的分类条件下,根据已知研究对象的观测数据和某些判别准则建立判别函数,对未知对象做出合理的判别分类。常用的判别方法有距离判别法、Fisher判别法、Bayes判别法和逐步判别法[18-20]。
-
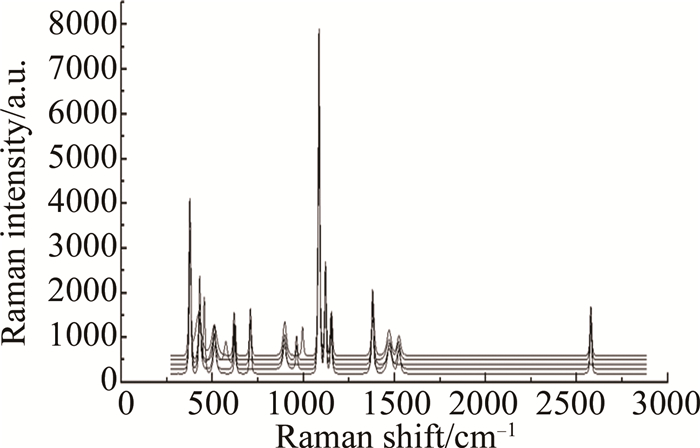
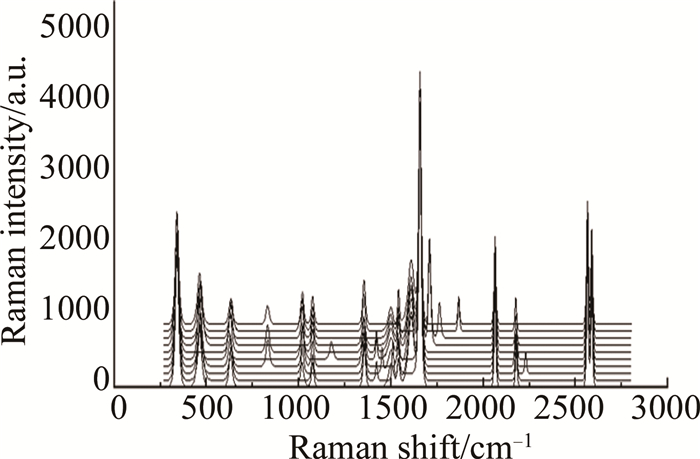
重现性实验结果见图 1,均匀性实验结果见图 2。由图 1和图 2可以看出, 样品的差分喇曼光谱谱图的峰数、峰位、峰形和峰强基本一致,仅个别受宇宙射线的干扰,如图 1所示的10次实验中出现的1180cm-1, 1705cm-1, 1763cm-1, 1866-1和2230cm-1;图 2中出现的574cm-1和998cm-1,单次实验出现干扰峰的数目最多不超过1个,对实验影响很小。实验结果表明:该方法重现性良好,样品的均匀性良好,可用该方法对烟用内衬纸进行检验分析。
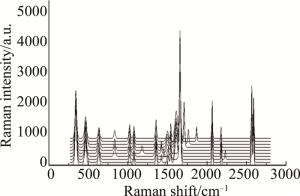
Figure 1. Reproducible experiment results of 13# sample
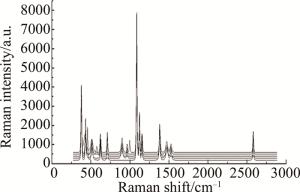
Figure 2. Homogeneity experiment results of 27# sample
-
在生产过程中,生产厂家为了填补植物纤维间的空隙,提升纸张的性能,降低成本,常会加入不同种类、配比、产地、加工工艺的填料和胶料,这些差异会反映在差分喇曼谱图中,为利用差分喇曼光谱法检验烟用内衬纸提供了理论依据。烟用内衬纸常用的填料有:碳酸钙、高岭土、滑石粉、钛白粉、氧化锌、硫酸钡、二氧化硅等。不同种类的烟用内衬纸都含有植物纤维素,区别主要在于填料。植物纤维素及常见填料的喇曼特征峰见表 2。由表 2可以看出,填料和纤维素,填料和填料之间,存在很多相近的特征峰,根据某个特征峰无法判断出是否含有该填料,因此结合仪器实际的扫描范围,对表 2中的特征峰进行剔除筛选。经过筛选,可以得出识别碳酸钙的特征峰为711cm-1, 1085cm-1;识别高岭土的特征峰为393cm-1, 636cm-1;识别滑石粉的特征峰为289cm-1, 360cm-1, 674cm-1;识别硫酸钡的特征峰为459cm-1, 1138cm-1。
Table 2. Raman characteristic peaks of cellulose and commonly used fillers for cigarette liner paper
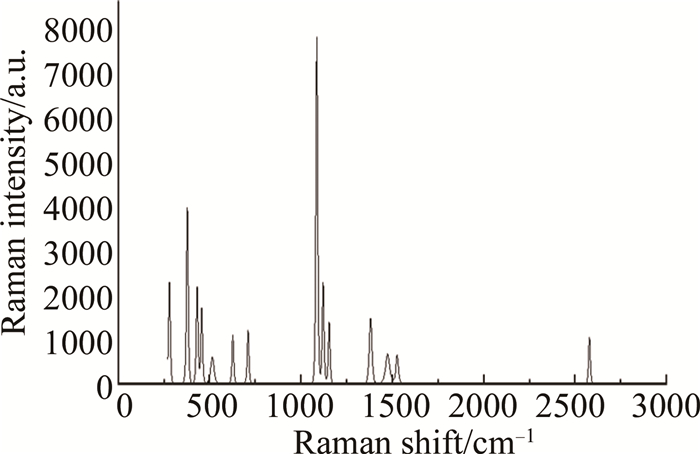
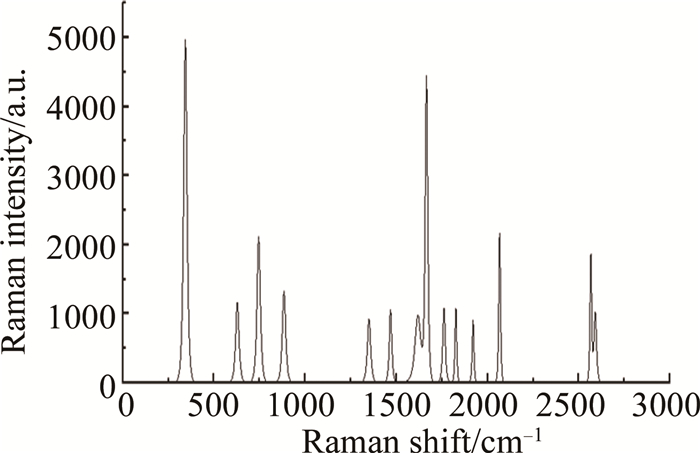
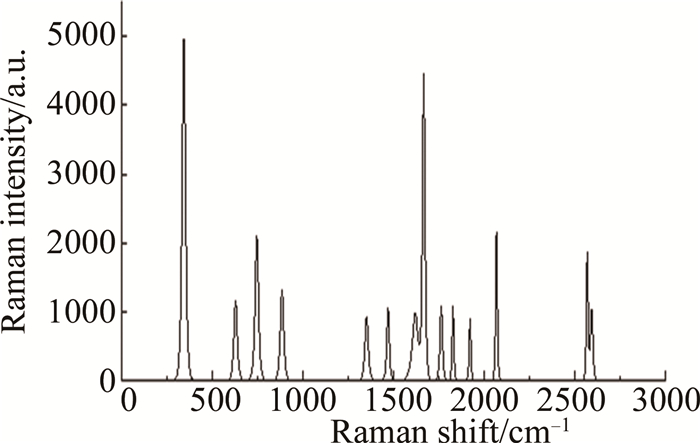
filler name raman characteristic peak/cm-1 cellulose 169, 378, 382, 434, 457, 896, 993, 1094, 1119, 1292, 1338, 1379, 1409, 1471 calcium carbonate 153, 280, 711, 1085 kaolin 140, 393, 636 talcum 106, 192, 289, 360, 430, 464, 674, 1048, 1096 sulphate 279, 459, 616, 986, 1085, 1138 通过对44个烟用内衬纸样品的差分喇曼光谱谱图初步分析,发现依据主要填料的不同可将样品分为4大类(分类结果见表 3)。第1类样品中只含有碳酸钙(见图 3),第2类样品只含有高岭土(见图 4),第3类样品既不含有碳酸钙,也不含有高岭土(见图 5);第4类样品既含碳酸钙又含高岭土(见图 6)。
Table 3. Classification results of cigarette liner
group sample number 1 1#, 8#, 9#, 24#, 26#, 27#, 33# 2 2#, 3#, 5#, 6#, 7#, 11#, 12#, 17#, 20#, 21#, 22#, 23#, 28#, 29#, 30#, 31#, 39#, 41#, 42#, 44# 3 4#, 15#, 18#, 19#, 34#, 35#, 36#, 37#, 40#, 43# 4 13#, 14#, 16#, 25#, 38# 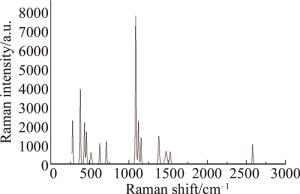
Figure 3. Differential Raman spectrum of sample 27#
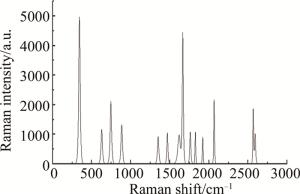
Figure 4. Differential Raman spectrum of sample 28#
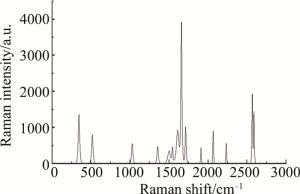
Figure 5. Differential Raman spectrum of sample 19#
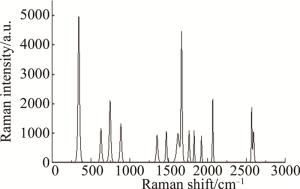
Figure 6. Differential Raman spectrum of sample 38#
通过直接比对光谱图并依据样品主要填料的不同,对样品进行分类的方法,结果直观,但不能避免人工主观带来的误差,且当样品成分较复杂时,比对难度也会增大,因此需要结合多种客观分析方法,以期达到准确的区分效果。
-
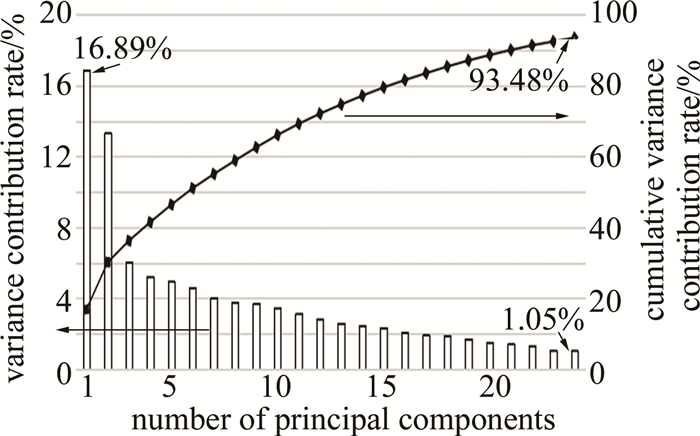
实验中将44个样品的喇曼数据处理成喇曼位移-喇曼强度的2维数组,由于变量(喇曼位移)数目较多,故采用主成分分析对数据进行降维,各主成分得分情况见图 7。贡献率是指单个主成分在总变异中占据的比例,代表了此主成分对因变量的影响力大小;累计贡献率表示了当前选择的所有主成分携带原数据的信息的比例。由图 7可知,提取的24个主成分包含了原喇曼光谱数据93.48%的信息量,其中主成分1贡献最大,为16.89%,表明其对44个样本数据的影响力较强,主成分24的方差贡献率小,为1.05%,其对44个样本数据影响力较弱。
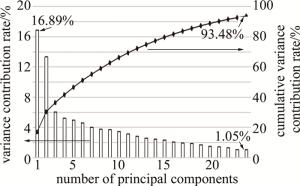
Figure 7. Sample principal component score
-
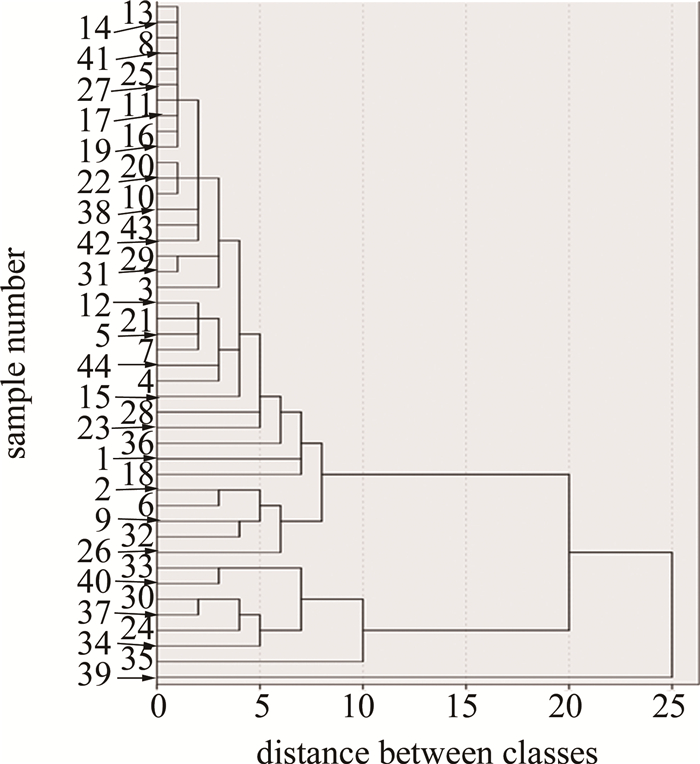
将3.3节中得出的前24个主成分进行系统聚类分析,用平方欧氏距离度量类间距离,聚类方法选择瓦尔德法,聚类结果谱系图见图 8。
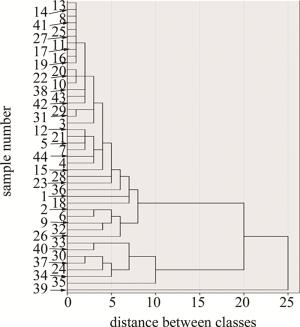
Figure 8. System clustering pedigree
由图 8可知,当类间距离为最小值时,样品被分为32类;当类间距离为5时,样品被分为10类,当类间距离达到阈值25时,所有样品被归为一类。为选择合理的分类,以连接距离为依据,抽取9#, 13#, 14#, 29#, 39#这5个样品,考察它们的显著性P值和Pearson相关系数,计算结果见表 4。
Table 4. Correlation results of 5 samples
samplenumber parameter 9# 13# 14# 29# 39# 9# Pearson correlation 1 P value 0.000 13# Pearson correlation 0.533 1 P value 0.000 14# Pearson correlation 0.548 0.984 1 P value 0.000 0.000 29# Pearson correlation 0.407 0.932 0.927 1 P value 0.000 0.000 0.000 39# Pearson correlation 0.407 0.414 0.387 0.367 1 P value 0.000 0.000 0.000 0.000 由表 4可知, 5个样品的P值都为0.000,说明它们之间的差异具有高度统计学意义。13#和14#,14#和29#的相关系数分别为0.984和0.927,表明两者的相关性很强,而9#, 39#和其余样品的相关系数均小于0.7,说明其相关性较弱,因此可以将13#, 14#, 29#样品分为一类,9#, 39#样品各自单独成一类。同理,通过对不同组间距离分类的结果进行相关性检验,比较P值和Pearson相关系数,发现:当组间距离为7时,分类效果最好,此时样品被分为5类,分类结果见表 5。
Table 5. Clustering results
group sample number 1 35# 2 39# 3 24#, 30#, 33#, 34#, 37#, 40# 4 2#, 6#, 9#, 26#, 32# 5 1#, 3#, 4#, 5#, 7#, 8#, 10#, 11#, 12#, 13#, 14#, 15#, 16#, 17#, 18#, 19#, 20#, 21#, 22#, 23#, 25#, 27#, 28#, 29#, 31#, 36#, 38#, 41#, 42#, 43#, 44# -
考虑到在实际办案中,判断未知样本的类别情况意义重大,因此,用主成分分析提取的24个主成分构建判别分析,在数据分析中,判别分析常和聚类分析联合起来使用,这里利用3.4节中聚类分析得出的最佳分类结果,选择各类别的先验概率与其样本量成正比进行计算,使用合并的类内协方差矩阵进行分析,得到了各样本的特征值输出和Wilk lambda检验结果(见表 6)。
Table 6. Eigenvalue output and Wilk lambda test results of each sample
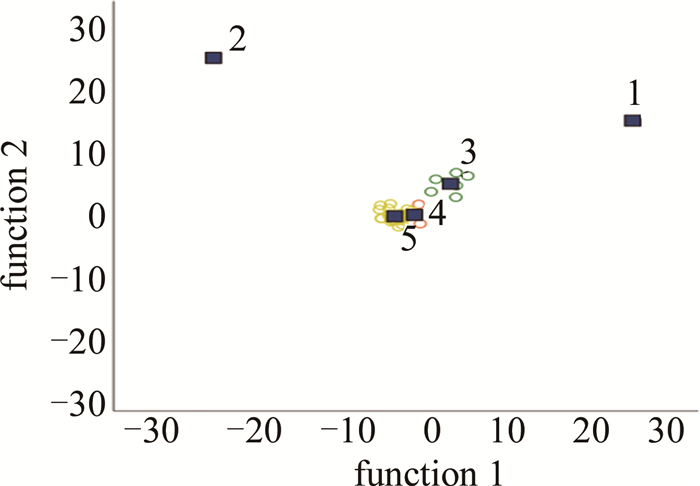
function variance percentage cumulative percentage canonical correlation function test Wilk lambda P value 1 47.7 47.7 0.986 1~4 0.000 0.000 2 33.4 81.1 0.980 2~4 0.001 0.000 3 14.6 95.7 0.956 3~4 0.021 0.000 4 4.3 100.0 0.871 4 0.242 0.000 由表 6可知,该模型构建了4个典则判别函数,其中函数1携带了47.7%的原始信息,函数2携带了33.4%的原始信息,前两个函数的累计百分比达81.1%,能较好的解释原始数据的基本特征。Wilk lambda检验结果用于检验各个判别函数有无统计学上的显著意义,函数1、函数2的Wilk lambda数值都极接近0,表示组间变异较大,且P值均为0,说明这两个判别函数的作用都是显著成立的。综上所述,选择函数1和函数2建立联合分布散点图(见图 9),并得出判别结果(见表 7)。
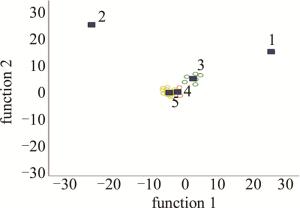
Figure 9. Scatter plot of joint distribution of 5 samples
Table 7. Discriminant analysis results
classification resultsa classi-fication prediction group member information total 1 2 3 4 5 count number 1 1 0 0 0 0 1 2 0 1 0 0 0 1 3 0 0 6 0 0 6 4 0 0 0 5 0 5 5 0 0 0 0 31 31 percentageof number/% 1 100.0 0.0 0.0 0.0 0.0 100.0 2 0.0 100.0 0.0 0.0 0.0 100.0 3 0.0 0.0 100.0 0.0 0.0 100.0 4 0.0 0.0 0.0 100.0 0.0 100.0 5 0.0 0.0 0.0 0.0 100.0 100.0 由图 9可以看出,5类样本的质心在整体上得到了区分。第1类、第2类、第3类样品在水平方向上,类与类之间的距离均超过20,因此这3类样本在函数1判别轴上区分明显;第2类样本和第4类和第5类样本在竖直方向上,间隔的距离超过20,因此第2类和第4类和第5类样本在函数2判别轴上区分明显;第4类样本和第5类样本在图 9中区分不是十分明显,通过调节函数1判别轴的取值范围,如图 10所示,将数值范围(-30,30)调节为(-5,5),可以看出,第4类和第5类的质心在水平方向上仍然可以得到很好的区分。结合表 7中的判别分析结果可知, 该模型能对5类烟用内衬纸样品做出100%的正确分类。如果想考察未知样本的分类情况,只需要将相应数据代入上述两个判别函数,就可以联合分布图上找到位置,从而完成对未知样本的类别判定。
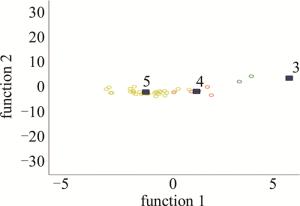
Figure 10. Scatter plot after changing the axis scale of function 1
-
利用最新的差分喇曼光谱技术对44个烟用内衬纸样品(隶属于20个品牌)做出检验,根据样品中主要填料的不同,对样品差分喇曼光谱谱图做出解析比对,将样品分为了4类,分类结果较为直观。又结合化学计量法对实验数据作出处理,使用主成分分析提取了24个有效主成分,降低了数据变量的信息重叠,用降维后的数据做聚类分析,将样品分为了5类,并建立了判别式,对44个样品做出了100%的正确判别,实验结果理想,并给未知样品的判别提供了依据。该方法无损样本,快速准确,将差分喇曼谱图分析法和化学计量学方法有效地结合在一起,可为公安实践工作中对微量物证的判别检验提供参考。今后,将进一步收集样本,扩大样本容量,尝试结合其它新型判别分类方法,以期达到对烟用内衬纸科学的分类研究目的,为法庭科学中物证的鉴别提供帮助。
差分喇曼光谱结合化学计量学检验烟用内衬纸
Differential Raman spectroscopy combined with stoichiometry for inspection of cigarette liner
-
摘要: 为了建立一种检验现场残留烟用内衬纸的科学方法,采用最新的差分喇曼光谱技术对44个不同品牌、不同系列的样品进行了检验,依据样品中主要填料的不同对样品进行了分类。结合化学计量学,将经主成分分析降维后的数据用来聚类分析,用显著性P值和Pearson相关系数评价聚类结果的好坏,得出的最优聚类结果用来建立判别式。结果表明,经解析比对谱图后可将样品分为4类; 建立的判别式实现了对44个样品100%的准确分类,并对未知样本的判别提供了依据。该方法结合谱图分析和化学计量学,能快速、无损、准确地对样品做出客观检验,具有一定的普适性, 为公安实际办案提供了理论依据。Abstract: In order to establish a scientific method for inspecting residual cigarette liners on site, the latest differential spectroscopy technology was used to inspect 44 different brands and different series of samples, and the samples were classified according to the different main fillers in the samples. Combined with chemometrics, the data reduced by principal component analysis was used for cluster analysis, and the significant P value and Pearson correlation coefficient were used to evaluate the quality of the clustering results. The optimal clustering results were used to establish discrimination formula. The results show that the samples can be divided into 4 categories after analyzing and comparing the spectra. The established discriminant realized 100% accurate classification of 44 samples, and provided a basis for the discrimination of unknown samples. In summary, the method combined with spectral analysis and chemometrics can quickly, non-destructively and accurately make objective inspections of samples. It has certain universality and provides a theoretical basis for the actual handling of cases by police.
-
Key words:
- spectroscopy /
- differential raman spectroscopy /
- chemometrics /
- cigarette liner /
- species identification
-
Table 1. Cigarette liner sample information
number brands and collections 1# Nanjing/Jinling twelve hairpins 2# Nanjing/red China west 3# Nanjing/Nanjing red 4# Nanjing/Jiapin 5# Nanjing/ninth five-year plan 6# Nanjing/Xuan He Men 7# Nanjing/Yuhua stone 8# Golden Leaf/golden hall 9# Golden Leaf/red flag canal 10# Golden Leaf/sky leaf 11# Golden Leaf/small gold 12# Golden Leaf/golden eye 13# Yellow Crane Tower/soft blue 14# Yellow Crane Tower/big choi 15# Yellow Crane Tower/tender valley 16# Yellow Crane Tower/wonderful view 17# Yellow Crane Tower/Yaxiang 18# Yellow Crane Tower/hardsafety 19# Yellow Crane Tower / 1916 Ruanpu 20# Liqun/soft red long mouth 21# Liqun/new edition 22# Liqun/national beauty 23# Yuxi/happy new year 24# Yuxi/hard box 25# Yuxi/soft box 26# Yuxi/original aspiration 27# Changbai Mountain/777 series 28# Marlboro/hard red 29# Marlboro/hard platinum 30# Marlboro/iqos 31# Su Yan/hard gold sand 32# Su Yan/gold sand C 33# Dunhill/blue 34# Yunyan/purple 35# Zhongnanhai/extra high 36# Taishan/luxury 37# Peony/soft export 38# 555/Jin Rui 39# Diamond/lotus 40# Lanzhou/hard boutique 41# Furong King/hard box 42# Double Happiness/boutique 43# Hongtashan/classic 1956 44# Seven Stars/sky blue  下载: 导出CSV
Table 2. Raman characteristic peaks of cellulose and commonly used fillers for cigarette liner paper
filler name raman characteristic peak/cm-1 cellulose 169, 378, 382, 434, 457, 896, 993, 1094, 1119, 1292, 1338, 1379, 1409, 1471 calcium carbonate 153, 280, 711, 1085 kaolin 140, 393, 636 talcum 106, 192, 289, 360, 430, 464, 674, 1048, 1096 sulphate 279, 459, 616, 986, 1085, 1138
下载: 导出CSV
Table 3. Classification results of cigarette liner
group sample number 1 1#, 8#, 9#, 24#, 26#, 27#, 33# 2 2#, 3#, 5#, 6#, 7#, 11#, 12#, 17#, 20#, 21#, 22#, 23#, 28#, 29#, 30#, 31#, 39#, 41#, 42#, 44# 3 4#, 15#, 18#, 19#, 34#, 35#, 36#, 37#, 40#, 43# 4 13#, 14#, 16#, 25#, 38#
下载: 导出CSV
Table 4. Correlation results of 5 samples
samplenumber parameter 9# 13# 14# 29# 39# 9# Pearson correlation 1 P value 0.000 13# Pearson correlation 0.533 1 P value 0.000 14# Pearson correlation 0.548 0.984 1 P value 0.000 0.000 29# Pearson correlation 0.407 0.932 0.927 1 P value 0.000 0.000 0.000 39# Pearson correlation 0.407 0.414 0.387 0.367 1 P value 0.000 0.000 0.000 0.000
下载: 导出CSV
Table 5. Clustering results
group sample number 1 35# 2 39# 3 24#, 30#, 33#, 34#, 37#, 40# 4 2#, 6#, 9#, 26#, 32# 5 1#, 3#, 4#, 5#, 7#, 8#, 10#, 11#, 12#, 13#, 14#, 15#, 16#, 17#, 18#, 19#, 20#, 21#, 22#, 23#, 25#, 27#, 28#, 29#, 31#, 36#, 38#, 41#, 42#, 43#, 44#
下载: 导出CSV
Table 6. Eigenvalue output and Wilk lambda test results of each sample
function variance percentage cumulative percentage canonical correlation function test Wilk lambda P value 1 47.7 47.7 0.986 1~4 0.000 0.000 2 33.4 81.1 0.980 2~4 0.001 0.000 3 14.6 95.7 0.956 3~4 0.021 0.000 4 4.3 100.0 0.871 4 0.242 0.000
下载: 导出CSV
Table 7. Discriminant analysis results
classification resultsa classi-fication prediction group member information total 1 2 3 4 5 count number 1 1 0 0 0 0 1 2 0 1 0 0 0 1 3 0 0 6 0 0 6 4 0 0 0 5 0 5 5 0 0 0 0 31 31 percentageof number/% 1 100.0 0.0 0.0 0.0 0.0 100.0 2 0.0 100.0 0.0 0.0 0.0 100.0 3 0.0 0.0 100.0 0.0 0.0 100.0 4 0.0 0.0 0.0 100.0 0.0 100.0 5 0.0 0.0 0.0 0.0 100.0 100.0
下载: 导出CSV
-
[1] JIANG H. Cigarette physical evidence inspection[M]. Beijing:Chinese People's Public Scurity University Press, 2018:247-250(in Chinese). [2] WANG R N, HAN L, HUI F Q, et al. Research on moisture, moisture and fragrance of the liner paper for ceramic-plated tobacco[J]. Packaging Engineering, 2019, 40(15): 130-135(in Chinese). [3] CHEN Y, YANG G T, YE Ch W, et al. Comparative analysis of the performance of different types of cigarette liners[J]. China Papermaking, 2016, 35(7): 70-74(in Chinese). [4] JIANG H, SHI H Q, WANG Ch Y, et al. Infrared spectrum inspection of packaging paper in cigarette cases[J]. Research Progress in Chemical Issues in Public Safety, 2013, 3: 517-521(in Chinese). [5] WANG Zh G, WANG C H, SUN S Q, et al. FT-Raman spectral examination of electrostatic copy paper[J]. Criminal Technology, 2001 (4): 17-19(in Chinese). [6] YU J, ZHANG Y, PANG S Y, et al. Spectral inspection of bank documents[C]// Proceedings of the 18th National Molecular Spectroscopy Conference. Beijing: the Chinese Optics Society, 2014: 57-64(in Chinese). [7] CHEN Y T, JIANG H. Scanning electron microscopy spectroscopy method to identify the type of cigarette liner paper[J]. Heilongjiang Paper, 2017, 45(4): 9-22(in Chinese). [8] GUO P, JIANG H. X-ray fluorescence spectroscopy for inspection of liner paper for tobacco[J]. Zhonghua Paper, 2015 (18): 32-35(in Chinese). [9] WU R J, JIANG H. X-ray fluorescence spectroscopy for the detection of cigarette paper[J]. China Paper, 2016(12): 63-66(in Chinese). [10] GUO P, JIANG H. Study on Raman spectroscopy of cigarette liner paper[J]. Zhonghua Paper, 2016(12): 53-58(in Chinese). [11] FANG G, YIN L, LIU F, et al. Application of differential Raman technology in fluorescence suppression[J]. Laser Technology, 2019, 43(3): 359-362(in Chinese). [12] GUI D D, LU Q, JIN C C, et al. Research on the extraction and analysis of Raman spectral features of dairy products based on sparse principal component analysis[J]. Spectroscopy and Spectral Analysis, 2018, 38(s1):133-134(in Chinese). [13] MENG Q L, ZHANG Y, SHANG J. Non-destructive detection of apple surface scars by optical fiber spectrum combined pattern recognition[J]. Laser Technology, 2019, 43(5): 676(in Chinese). [14] OUYANG Y P, CHENG L, WU H Ch, et al. Research on general model for qualitative and quantitative analysis of alcohol gasoline[J]. Laser Technology, 2019, 43(3): 363-368(in Chinese). [15] GHOSH A, RAHA S, DEY S, et al. Chemometric analysis of integrated FTIR and Raman spectra obtained by non-invasive exfoliative cytology for the screening of oral cancer[J]. Analyst, 2019, 144(4): 1309-1325. [16] PRAENE J P, MALET-DAMOUR B, RADANIELINA M H, et al. GIS-based approach to identify climatic zoning: A hierarchical clustering on principal component analysis[J]. Building and Environment, 2019, 164: 106330. doi: 10.1016/j.buildenv.2019.106330 [17] JIANG H, REN J W, JU Ch Y, et al. X-ray fluorescence spectrometry combined with cluster analysis for testing aluminum-plastic packaging tablets[J]. Advanced Chemical Materials, 2019, 47(11): 194-198(in Chinese). [18] BARRA I, KHARBACH M, BOUSRABAT M, et al. Discrimination of diesel fuels marketed in Morocco using FTIR, GC-MS analysis and chemometrics methods[J]. Talanta, 2020, 209: 120543. doi: 10.1016/j.talanta.2019.120543 [19] DUMALISILE P, MANLEY M, HOFFMAN L, et al. Discriminating muscle type of selected game species using near infrared (NIR) spectroscopy[J]. Food Control, 2020, 110: 106981. doi: 10.1016/j.foodcont.2019.106981 [20] GIANNETTI V, MARIANI M B, MARINI F, et al. Flavour fingerprint for the differentiation of Grappa from other Italian distillates by GC-MS and chemometrics[J]. Food Control, 2019, 105: 123-130. doi: 10.1016/j.foodcont.2019.05.028 -

 点击查看大图
图(10) / 表(7)
计量
- 文章访问数: 10793
- HTML全文浏览量: 8466
- PDF下载量: 13
- 被引次数: 0
