 网站地图
网站地图


-
文物在出土后,表面会有较厚的锈层或者其它附着物,局部甚至全部掩盖文物信息,以至于通过直接观察很难完整地显现信息,而在未知的情况下对文物进行保护或修复处理,容易对其造成伤害。X射线成像技术作为5种常用的无损检测技术之一,可以在文物检测与文物信息重建中广泛应用,在我国文物研究中,随着文物保护工作的日益完善与更加科学化的保护研究,X射线检测技术越来越受到重视和普及,使得在文物保护方面也得到了技术支持与推进[1]。X光片上表现的信息较少地受到表面腐蚀物的干扰,它所呈现的文物面貌比肉眼直接观察更为精准。X光射入文物后,会与文物发生相互作用,被文物材质吸收或被其散射。不同材质和厚度的文物对X光的反应不同,从而使X光射线的强度在射穿文物后发生不同程度的衰减[2]。材料中所含元素的相对原子数越大,材料厚度越厚,对X射线吸收越强。因铜镜的边缘区和纹饰区的厚度不同,最佳X光投射强度也不同。因此,分别使用边缘区和纹饰区的最佳投射强度,会得出两幅X光片,两幅X光分别集中了边缘区和纹饰区的详细信息,图像融合技术可良好地融合铜镜的详细信息。
图像融合是通过计算机技术和图像处理等技术,将多源通道收集的相同目标图像,提取每个通道的数据,并且集成有利信息用来形成高质量图像的处理过程[3-4]。小波变换因其良好的时频局部性和多分辨性,已成为非平稳信号分析的常用工具,被广泛应用于包括图像融合在内的图像处理之中[5]。近几十年里,图像融合研究取得了长足的发展,出现了许多的融合方法和融合策略,而基于多分辨率分析的图像融合方法考虑到人眼视觉系统的敏感特性,将图像分解到不同尺度空间,有针对性地突出图像的重要特征和细节信息[6]。实际上,大多都是可见光与多传感器的多源图像融合,如CHEN等人使用小波变换的方法融合了红外与X光的图像融合[7]。ZHANG等人使用稀疏表示对遥感图像进行融合[8]。X光多源图像融合仅在医学影像领域有所应用与研究,CHEN等人使用光线跟踪配准图像算法融合多源X光图像的信息融合[9]。YANG等人使用提升小波变换融合医学上的计算机断层扫描(computed tomography, CT)与核磁共振成像(magnatic resonance imaging, MRI)图像等[10]。但X光多源图像融合在文物信息重建方面尤为缺乏。
-
图像融合可以根据信息流的不同分为不同的融合等级,分别为像素级图像融合、特征级图像融合和符号决策级图像融合[11-13]。
图像在像素级的融合是最基本的图像融合,它将不同的物理参量进行融合。根据融合策略直接在源图上进行处理,组合源图像中的像素得到融合图像[14]。但由于它对像素进行操作,计算机必须处理大量数据,并且处理需要很长时间,因此合并后的图像不能及时显示出来,无法实现实时处理。
特征级图像融合首先根据图像的纹理、对比度、形状等进行特征提取,然后融合源图像的特征域,最后将这些特征融合到同一图像中。特征级融合对图像信息进行了压缩,实时性有所提高。因图像特征被提取为融合信息,所以丢失了许多细节特征。
符号决策级图像融合是对图像信息更高的抽象融合,融合方法是从源图像中抽取特征和分类,处理得到各个决策的权值与置信度,并将这些转化成全局最佳决策,每个适应特征的选择取决于实际情况中的不同因素。符号决策级图像融合的计算量是最小的,且对前两种方法具有很强的依赖性。
-
近20多年,已经提出了许多用于构造小波及其滤波器组的方法,用于工程应用领域和信号处理,如正交小波、半正交小波和双正交小波等。
这些方法大多数在频域中构建,并且过程较复杂。1995年,贝尔实验室的SWELDENS博士提出了一种不依赖于Fourier变换的第2代小波构造方法, 利用时域提升模式构造小波。与塔式算法相比,第2代小波变换方法是一种更有效的小波变换实现方法。它的优势有以下4点:(1)不需要进行Fourier变换,变换过程直接在时域内完成,同时继承了第1代小波多分辨率的特性,具有很强的适应性与灵活的结构设计能力;(2)灵活性和通用性强,小波函数的改善是使用简单的小波函数改进小波基的特征来实现的;(3)它不再是一种特定小波函数通过尺度和平移得到,适合于不等间隔采样的构造问题;(4)存储量相对较小,执行效率高、且算法简单、运算速度快,可以分析任意长度的信号。
1998年,DAUBECHIES和SWELDENS证明任何具有有限冲击响应滤波器的离散小波变换都可以通过一系列简单的多步提升步骤来解决。即可以使用第1代小波变换算法实现的所有离散小波变换都可以使用第2代小波方法来实现。这个结论建立了离散小波变换与提升小波之间的联系。目前,第2代小波具有多种构造方法,包括基于提升方法的第2代小波构造、冗余第2代小波构造、自适应第2代小波构造、自适应冗余第2代小波构造等等。在众多领域得到广泛应用。
提升小波分解主要包含3个步骤:分解、对偶提升和主要提升[16-17]。
分解:在符合完全重构要求的前提下,将原始输入信号x分解成偶数序列和奇数序列,即$x_{{\rm{e}}}(n)=x(2 n), x_{0}(n)=x(2 n+1) $。
对偶提升:基于初始信号的相关性,用偶数序列预测奇数序列,预测误差$d(n)=x_{\mathrm{o}}(n)-P\left[x_{\mathrm{e}}(n)\right] $,其中, P[]为预测算子,d(n)反映原始信号x中的高频信息。
主要提升:使用d(n)更新偶数序列xe(n),即c(n)=xe(n)+U[d(n)],其中, U[]为更新算子,c(n)为原始输入信号x的低频信息。
-
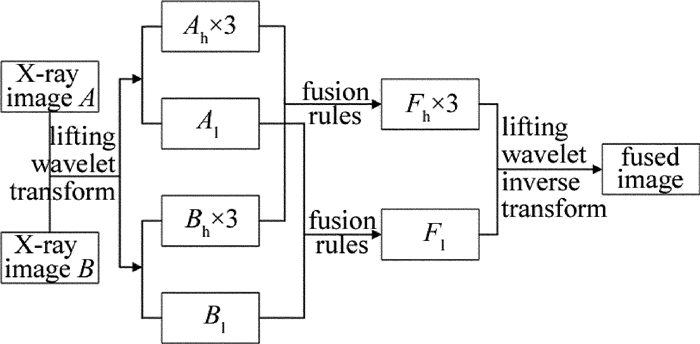
在X光图像融合算法中,首先要确定融合规则。古铜镜X光的源图像经过提升小波分解后可得到X光图像的低频分量(Al, Bl)和高频分量(Ah, Bh),需采用不同的规则分别对低频分量和高频分量进行融合(Fh, Fl)。目前,低频分量的融合方法主要有单像素融合,一般采用加权平均的方法进行融合。高频分量采用区域融合,包含有区域方差,模极大值等方法进行融合[18-21]。单像素点融合方法忽略了单点像素与周围像素的相关性,会使融合后的图像过渡不自然,但其融合速度快。加权平均的融合规则会降低图像前景与背景之间的差异,使得融合后图像的对比度降低。传统方法中高频分量大多使用区域特征来确定融合规则,增加了融合后图像的对比度浮动。融合框架如图 1所示。
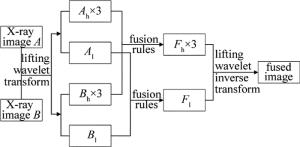
Figure 1. Image fusion frame based on lifting wavelet
-
X光图像富有大量的能量信息,低频子带继承了X光图像的大部分能量。加权平均准则和取系数极大值等融合规则在融合过程中会使得融合图像的对比度减弱,使得图像的信息丢失。区域能量与区域方差相结合可以很好地避免这种情况,因为X光图像包含了大部分能量信息,低频分量包含了X光图像的能量信息,使用区域能量作为系数可以有效地保留X光图像的信息。区域方差反映了图像灰度的离散程度。极大地保留了图像目标特征。因此本文中提出使用区域方差与区域能量相结合,综合两者可更好地表达源图像的信息。
首先,计算低频子带以点(i, j)为中心的区域方差,区域方差定义如下:
$ {V_{1,M(N)}}(i,j) = \frac{1}{{S \times T}}\sum\limits_{m \in S} {\sum\limits_{n \in T} {\left[ {{C_{1,M(N)}}(i + m,j + n) - } \right.} } \\ \left.\bar{C}_{1, M(N)}(i, j)\right]^{2} $
(1) 式中,Vl, M(N)(i, j)为图像M, N低频子带, 以(i, j)为中心,区域大小为S×T的方差,本文中的S×T的取值为3×3;Cl, M(N)为图像第i行、第j列的低频系数;$ \bar{C}_{1, M(N)}$为该部分的系数平均值。
其次,图像以第i行、第j列为中心的低频子带区域能量定义如下:
$ {E_{1, M(N)}}(i, j) = \sum\limits_{m \in S} {\sum\limits_{n \in T} {{{\left[ {{C_{1, M}}(i + m, j + n)} \right]}^2}} } $
(2) 融合图像的低频子带系数以区域能量与区域方差来确定,当图像M的区域能量和区域方差都大于图像N时,选取图像M的低频子带系数作为融合图像系数;当图像M的区域能量和区域方差都小于图像N时,选取图像N的低频子带系数作为融合系数;当图像M的区域能量和区域方差都不大于或都不小于图像N时,本文中以区域能量的系数作为加权融合,图像M、N的区域能量占比值如下:
$ \left\{\begin{array}{l} {K_{M}=\frac{E_{1, M}(i, j)}{E_{1, M}(i, j)+E_{1, N}(i, j)}} \\ {K_{N}=\frac{E_{1, N}(i, j)}{E_{1, M}(i, j)+E_{1, N}(i, j)}} \end{array}\right. $
(3) 最后,低频子带融合后的系数可表示为:
$ C_{l, f}(i, j)=\left\{\begin{array}{l} {C_{1, M}(i, j), \left(V_{1, M}(i, j)>\right.} \\ {\left.V_{1, N}(i, j) \cap E_{1, u}(i, j)>E_{1, N}(i, j)\right)} \\ {C_{1, N}(i, j), \left(V_{1, M}(i, j) <V_{1, N}(i, j) \cap\right.} \\ {\left.E_{1, M}(i, j) <E_{1, N}(i, j)\right)} \\ {K_{M} C_{1, N}(i, j)+K_{N} C_{1, M}(i, j), (\text { other })} \end{array}\right. $
(4) -
图像边缘信息与图像纹理信息是高频子带融合的关键,图像的边缘及纹理含有大量的信息,X光图像边缘细节包含了纹饰区的大部分信息。X光图像的边缘细节是X光图像的重要特征。人类视觉特征主要以边缘及轮廓认识图像, 包含了图像的细节特性。目前大多数高频融合规则都是取图像特征求取理论最优解,而古铜镜X光根据镜缘区和纹饰区的材质与厚度已取得相应区域的最优解。因此使用空间频率在源图像上选取最优解,避免了融合时取特征权值后,降低或增加图像对比度和信息丢失的可能性。空间频率反映了图像的总体活动与清晰度。空间频率包含了行频率与列频率, 空间频率可定义为:
$ {f_{\rm{s}}} = \sqrt {f_{\rm{r}}^2 + f_{\rm{c}}^{\rm{2}}} $
(5) 式中,fr表示空间频率的行频率,fc表示空间频率的列频率,对于X×Y大小的图像,fr与fc的定义为:
$ f_{\mathrm{r}}=\sqrt{\frac{1}{X Y} \sum\limits_{i=1}^{X} \sum\limits_{j=2}^{Y}[f(i, j)-f(i, j-1)]^{2}} $
(6) $ f_{\mathrm{c}}=\sqrt{\frac{1}{X Y} \sum\limits_{i=2}^{X} \sum\limits_{j=1}^{Y}[f(i, j)-f(i-1, j)]^{2}} $
(7) 式中,X, Y表示总行数和总列数; f(i, j)表示位置(i, j)处的灰度值。
定义空间频率比$ \theta = {f_{{\rm{s}}, M, k}}\left( {{2^l}, i, j} \right)/{f_{{\rm{s}}, N, k}}\left( {{2^l}, i, j} \right)$。${f_{{\rm{s}}, M, k}}\left( {{2^l}, i, j} \right) $与$ {f_{{\rm{s}}, N, k}}\left( {{2^l}, i, j} \right)$分别表示在第k个融合子带、在分辨率为2l下, 点(i, j)的空间频率。按以下准则初步确定融合后的子带数据:
$ D_{k}\left(2^{l}, i, j\right)=\left\{\begin{array}{l} {D_{M, k}\left(2^{l}, i, j\right), (\theta>1)} \\ {D_{N, k}\left(2^{l}, i, j\right), (\text { else })} \end{array}\right. $
(8) 式中,$ {D_k}\left( {{2^l}, i, j} \right)$表示在第k个融合子带、在分辨率为2l下, 点(i, j)的融合值,${{D_{M, k}}\left( {{2^l}, i, j} \right)} $与$ {{D_{N, k}}\left( {{2^l}, i, j} \right)}$分别表示源图像M、源图像N在第k个融合子带,点(i, j)位置的融合值。
邻域选取S×T(本文中取3×3)大小的验证窗口,中心像素点的系数使用邻域8个像素点的系数来源窗口来验证并修正。修正的方式如下:目标像素点融合后的图像来源于图像M,且邻域8个像素超过1/2来源于N时,将中心像素替换为N在该位置的系数; 中心像素来源于图像N,且周围像素超过1/2来源于M时,将该中心像素位置的系数修改为M。
-
本实验中采用3组6幅古铜镜X光图像作为实验数据,采用的图像数据为陕西省文物保护研究院采集的古铜镜X光图像。实验中采用MATLAB仿真,平台为Intel i5-2400 3.1GHz四核处理器、4G内存。采集到的3组6幅古铜镜图像如图 2所示。图 2中,每组古铜镜X光图像都是采用边缘区和纹饰区的最佳投射强度采集的X光图像。
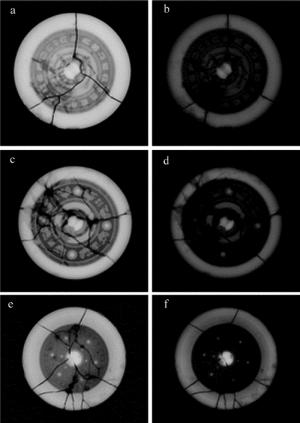
Figure 2. X-ray images of ancient bronze mirrors
-
为了能更加客观地评价融合图像的性能,实验对比了除本文中算法以外其它3种不同的算法,分别为加权平均+模极大值、加权平均+邻域方差、传统小波变换以及本文中的方法。实验结果如图 3、图 4和图 5所示。
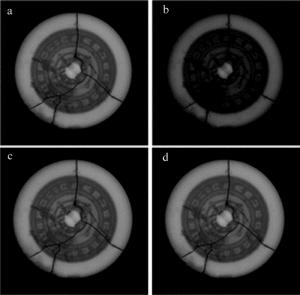
Figure 3. Fusion effect of ancient bronze mirrorⅠ

Figure 4. Fusion effect of ancient bronze mirror Ⅱ
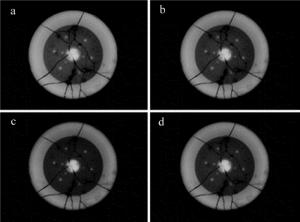
Figure 5. Fusion effect of ancient bronze mirror Ⅲ
融合得到的效果图一般采用图像信息熵、平均梯度与标准差来对融合图像进行客观评价比较。信息熵U反映了图像中平均信息量的多少,图像的信息熵越大,说明图像的保留的信息就越丰富,其定义为[7]:
$ U = - \sum\limits_{i = 0}^{L - 1} {{P_i}} {\log _2}\left( {{P_i}} \right) $
(9) 式中,Pi表示某一灰度值在图像中出现的概率,L为图像总灰度级数。
平均梯度V表现了图像的边界与影线两侧的灰度情况变化差异,也是图像的清晰度,图像的平均梯度越大,表明图像越清晰。平均梯度V的定义为:
$ \begin{aligned} V &=\frac{1}{(X-1)(Y-1)} \sum\limits_{m-1}^{X-1} \sum\limits_{n=1}^{Y-1} \frac{1}{4} \times \\ & \sqrt{\left[\frac{\delta g(m, n)}{\delta m}\right]^{2}+\left[\frac{\delta g(m, n)}{\delta n}\right]^{2}} \end{aligned} $
(10) 式中, g(m, n)表示图像在第m行、第n列的灰度值。
标准差W可以反映图像的灰度均值的状况,标准差越大,表现出的视觉效果越好,标准差的定义为:
$ W=\sqrt{\frac{\sum\limits_{m=1}^{X} \sum\limits_{n=1}^{Y}[G(m, n)-\bar{G}]^{2}}{X \times Y}} $
(11) 式中,G(m, n)表示点(m, n)的灰度值,${\bar G} $表示点(m, n)的平均灰度。
Table 1. Performance comparison of different fusion algorithms for ancient bronze mirror Ⅰ
information entropy average gradient standard deviation algorithm 1 6.0742 0.0220 30.4525 algorithm 2 6.0789 0.0225 30.2534 algorithm 3 6.0648 0.0243 30.6245 method of this paper 6.3854 0.0342 33.9648 Table 2. Performance comparison of different fusion algorithms for ancient bronze mirror Ⅱ
information entropy average gradient standard deviation algorithm 1 2.8542 0.0273 37.7843 algorithm 2 2.8631 0.0280 38.3145 algorithm 3 2.8653 0.0278 37.5247 method of this paper 2.9775 0.0332 39.6012 Table 3. Performance comparison of different fusion algorithms for ancient bronze mirror Ⅲ
information entropy average gradient standard deviation algorithm 1 3.5739 0.0343 36.7548 algorithm 2 3.6032 0.0335 35.6574 algorithm 3 3.5468 0.0344 35.8962 method of this paper 3.8625 0.0398 38.6214 从表中可以看出,本文中的算法在图像的信息熵、平均梯度和标准差上都略高于其它3种算法。分析表中数据可知,在3组铜镜实验中, 相对于其它3种算法,本文中的算法信息熵平均提升了5.76%,平均梯度平均提升了28.70%,标准差平均提升了7.70%,由此可知,本文中算法的融合图像在信息量清晰度视觉效果方面都优于其它算法。综合分析和对照数据可知:本文中提出的算法有效地保留了源图像的信息,对于边缘的传递效果更优秀。
-
文物研究和保护首要工作是完整科学地认识和分析文物信息,X光射线成像作为一种特殊的文物投影,它所呈现的文物面貌比肉眼观察更为精准,使用提升小波将源图像分别分解为低频子图和高频子图,并分别对其低频子图采用区域方差与能量加权、高频子图采用空间频率来确定融合规则。实验结果表明,该算法具有良好的融合效果,为文物保护工作者提供了更准确可靠的信息, 在文物信息重建领域有着广阔的应用前景。
基于提升小波的古铜镜X光图像融合方法研究
Study on fusion method of X-ray images of ancient bronze mirrors based on lifting wavelet
-
摘要: 为了将古铜镜X光图像信息综合到同一图像中, 采用提升小波的方式将源图像进行分解, 并分别对低频、高频采用不同的融合规则进行了图像融合。低频采用区域能量与区域方差相结合的方法, 高频采用空间频率加邻域像素点规范中间像素点的方法, 最后经提升小波逆变换得到目标图像; 同时进行了理论分析和实验验证, 取得了融合图像的信息熵、平均梯度和标准差数据。结果表明, 在3组实验中, 相对于其它几种算法, 本文中算法的信息熵平均提升了5.76%, 平均梯度平均提升了28.70%, 标准差平均提升了7.70%, 算法有效地保留了源图像的信息, 对于边缘的传递效果更优秀。这一结果对古铜镜X光图像的融合是有帮助的。Abstract: In order to synthesize X-ray image information of bronze mirrors into the same image, source image was decomposed by lifting wavelet. Different fusion rules were used for image fusion at low and high frequencies respectively. The method of combining regional energy with regional variance was used in low frequency. Spatial frequency combined with the method of neighborhood pixels to standardize intermediate pixels was used in high frequency. Finally, the target image was obtained by lifting inverse wavelet transform. Theoretical analysis and experimental verification were carried out. Information entropy, average gradient and standard deviation of the fused image were obtained. The results show that, in three groups of experiments, compared with the other three algorithms, information entropy of the proposed algorithm in this paper is increased by 5.76% on average. Average gradient is increased by 28.70%. Standard deviation is increased by 7.70% on average. The algorithm effectively preserves the information of the source image. Edge transmission effect is better. This result is helpful for the fusion of X-ray images of bronze mirrors.
-
Key words:
- image processing /
- image fusion /
- lifting wavelet /
- X-ray image /
- fusion rule
-
Figure 2. X-ray images of ancient bronze mirrors
a—fusion source image a of ancient bronze mirrorⅠ b—fusion source image b of ancient bronze mirrorⅠ c—fusion source image a of ancient bronze mirrorⅡ d—fusion source image b of ancient bronze mirrorⅡ e—fusion source image a of ancient bronze mirrorⅢ f—fusion source image b of ancient bronze mirrorⅢ
Figure 3. Fusion effect of ancient bronze mirrorⅠ
a—weighted average+modulus maxima b—weighted average+regional variance c—traditional wavelet d—the method of this paper
Figure 4. Fusion effect of ancient bronze mirror Ⅱ
a—weighted average+modulus maxima b—weighted average+regional variance c—traditional wavelet d—the method of this paper
Figure 5. Fusion effect of ancient bronze mirror Ⅲ
a—weighted average+modulus maxima b—weighted average+regional variance c—traditional wavelet d—the method of this paper
Table 1. Performance comparison of different fusion algorithms for ancient bronze mirror Ⅰ
information entropy average gradient standard deviation algorithm 1 6.0742 0.0220 30.4525 algorithm 2 6.0789 0.0225 30.2534 algorithm 3 6.0648 0.0243 30.6245 method of this paper 6.3854 0.0342 33.9648  下载: 导出CSV
Table 2. Performance comparison of different fusion algorithms for ancient bronze mirror Ⅱ
information entropy average gradient standard deviation algorithm 1 2.8542 0.0273 37.7843 algorithm 2 2.8631 0.0280 38.3145 algorithm 3 2.8653 0.0278 37.5247 method of this paper 2.9775 0.0332 39.6012
下载: 导出CSV
Table 3. Performance comparison of different fusion algorithms for ancient bronze mirror Ⅲ
information entropy average gradient standard deviation algorithm 1 3.5739 0.0343 36.7548 algorithm 2 3.6032 0.0335 35.6574 algorithm 3 3.5468 0.0344 35.8962 method of this paper 3.8625 0.0398 38.6214
下载: 导出CSV
-
[1] JIE J, YAN W X. Application and prospect of X-ray imaging techno-logy in bronze protection unearthed in collections[J]. Heritage World, 2016(2):74-77(in Chinese). [2] XIANG J K, ZHANG G, DONG Sh H, et al. Application of digital radiography to the research on wood carving.Science of Conservation and Archaeology, 2018, 30(3):105-110(in Chinese). [3] JIANG Z T, WU H, ZHOU X L. Infrared and visible image fusion algorithm based on improved guided filtering and dual-channel spiking cortical model[J]. Acta Optica Sinica, 2018, 38(2):2100002(in Chinese). [4] GE W, JI P Ch, ZHAO T Ch. Inrared and visible light images fusion of fuzzy logic on NSST domain[J]. Laser Technology, 2016, 40(6):892-896(in Chinese). [5] ZHU D R, XU L, WANG F B. Multi-focus image fusion algorithm based on fast finite shearlet transform and guided filter[J]. Laser & Optoelectronics Progress, 2018, 55(1):011001(in Chinese). [6] LIU Y, LIU S, WANG Z. A general framework for image fusion based on multi-scale transform and sparse representation[J]. Information Fusion, 2015, 24(7):147-164. [7] CHEN Sh Y, LIU J X, DING Y. Study on fusion method of infrared and X-ray images based on wavelet transform[J]. Laser Technology, 2015, 39(5):685-688(in Chinese). [8] ZHANG X, XUE Y J, TU Sh Q, et al. Remote sensing image fusion based on structural group sparse representation[J]. Journal of Image and Graphics, 2018, 21(8):1106-1118(in Chinese). [9] CHEN K H, YANG H M. 2D/3D registration method based on si-mulate a reconstructed X-ray image using ray casting method[J]. Journal of Changchun University of Science and Technology (Natural Science Edition), 2016, 39(2):103-106(in Chinese). [10] YANG Y Ch, DANG J W, WANG Y P. A medical image fusion method based on lifting wavelet transform and adaptive PCNN[J]. Journal of Computer-Aided Design & Graphics, 2012, 24(4):494-499(in Chinese). [11] YAO Q, YUAN Z. Weighted fusion algorithm for pixel-level multiresolution images[J]. Journal of Discrete Mathematical Sciences & Cryptography, 2018, 21(2):363-368. [12] GAO Y, WANG A M, WANG F H, et al. Application of improved wavelet transform algorithm in image fusion[J]. Laser Technology, 2013, 37(5):690-695(in Chinese). [13] ROKNI K, MUSA T A, HAZINI S, et al. Investigating the application of pixel-level and product-level image fusion approaches for monitoring surface water changes[J]. Natural Hazards, 2015, 78(1):1-12. doi: 10.1007/s11069-015-1861-0 [14] YU L, XUN C, WANG Z, et al. Deep learning for pixel-level image fusion: Recent advances and future prospects[J]. Information Fusion, 2018, 42(7):158-173. [15] ZHANG D F. MATLAB wavelet analysis[M]. Beijing: Mechanical Industry Press, 2009: 120-125(in Chinese). [16] LI L L, DING M Y. Fast image fusion method based on lifting wavelet transform[J]. Mini-Micro Systems, 2005, 26(4): 667-670(in Chinese). [17] LI J F, JIANG X L, DAI W Zh. Medical image fusion based on lifting wavelet transform[J]. Journal of Image and Graphics, 2014, 19(11): 1639-1648(in Chinese). [18] XU X J, WANG Y R, CHEN Sh. Novel image fusion method based on downsampling fractional wavelet transform[J]. Chinese Journal of Scientific Instrument, 2014, 35(9):2061-2069(in Chinese). [19] VIVONE G, RESTAINO R, MURA M D. Contrast and error-based fusion schemes for multispectral image pansharpening[J]. IEEE Geo-science & Remote Sensing Letters, 2014, 11(5): 930-934. [20] ZHAO J F, CUI G M, GONG X L, et al. Fusion of visible and infrared images using global entropy and gradient constrained regularization[J]. Infrared Physics & Technology, 2017, 81(3): 201-209. [21] YU N N, QIU T S. Fusion technology of infrared and visible image in compressive sensing[J]. Singnal Processing, 2012, 28(5): 692-698. -

 点击查看大图
计量
- 文章访问数: 6193
- HTML全文浏览量: 4834
- PDF下载量: 17
- 被引次数: 0
